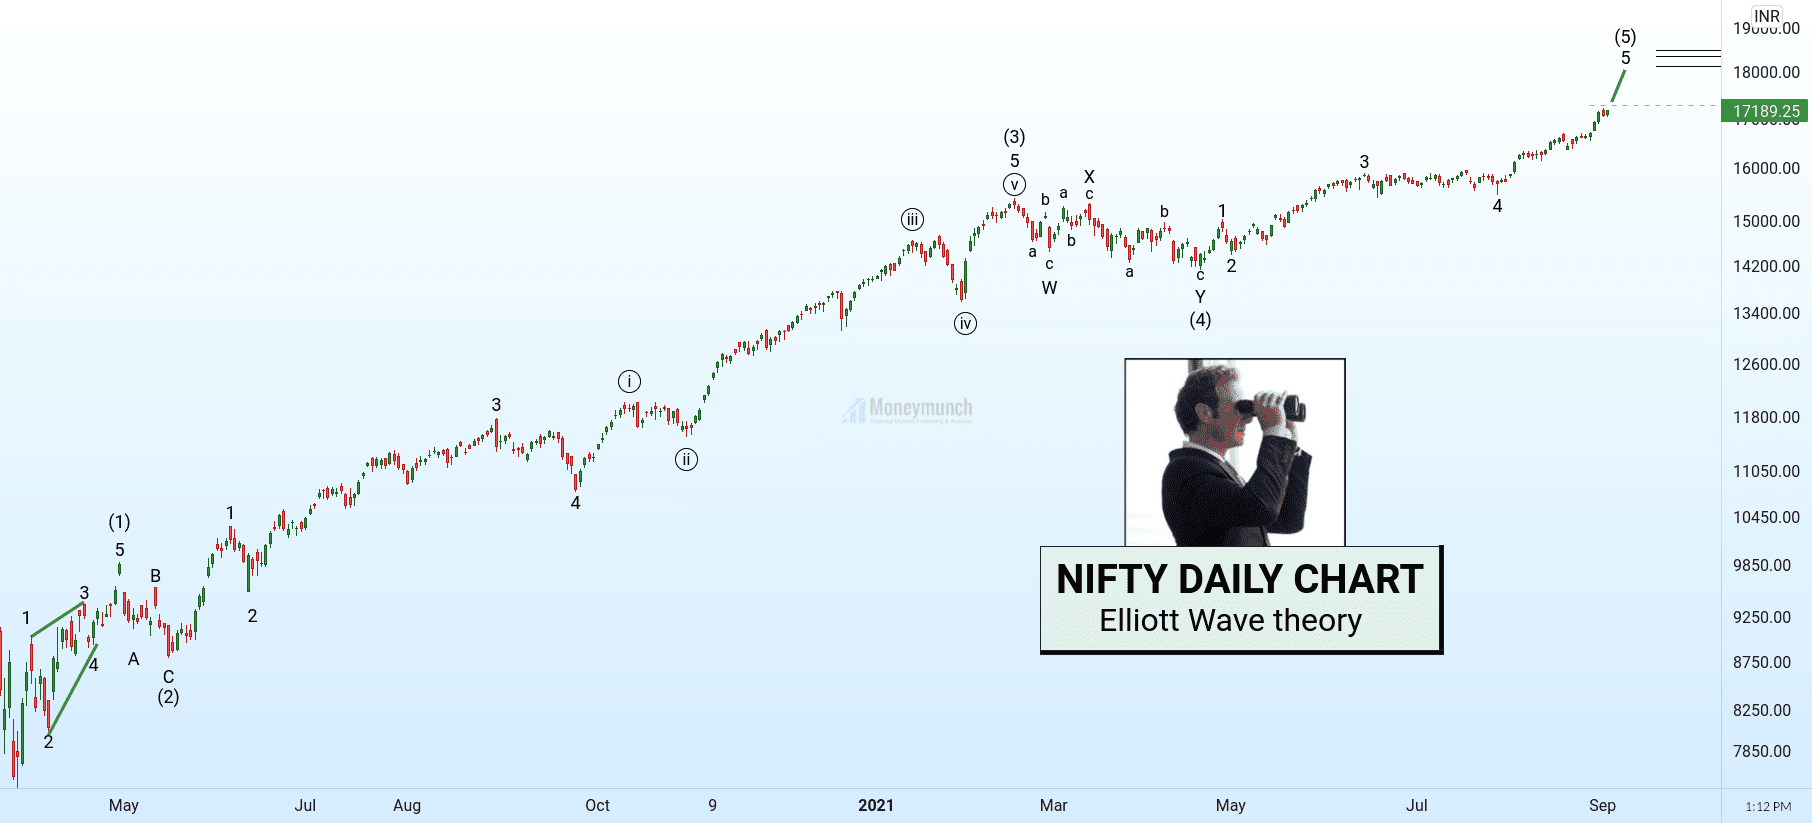
EWT: Will Nifty Hit 18000 Before September End?

free nifty stock tips daily chart

Extending wave (5) should easily travel above 18000 and is likely to continue toward 18480.

Target 1: 18000
Target 2: 18142
Target 3: 18350
Target 4: 18480

To become a subscriber, subscribe to our free newsletter services. Our service is free for all.

Continue reading

Trade-Setups on Maruti Short Target 6639 and 6483

How to find the next wave after the development of extended waves?
Two terms are important to understand for this Sample.
  • Extended Wave – The biggest wave of three impulsive waves (W1, W3, or W5) for the motive phase. In this, we expect gaps, surged, sharp moves in it.
  • Difference between points – A wave has two points, the starting and ending point. The distance between them is the difference between those points. For example, Wave 1 traveled from Rs. 30 points to Rs. 45 point. As a result, the difference between 45- 30 points is “15”.
The formula that we will use to find the 5th wave:

Difference of, 5th Wave = 3rd wave Extended – 1st WaveContinue reading

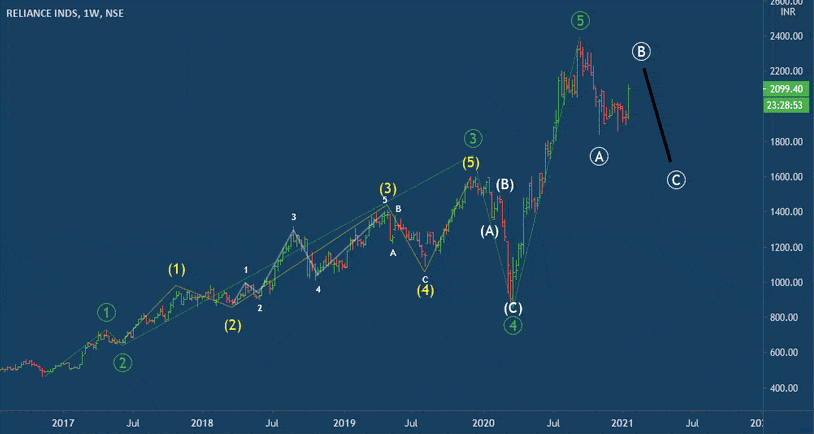
RELIANCE: EW target and Reversal point for ABC correction

We’ve traded today

This CALL was given to our SUBSCRIBERS:

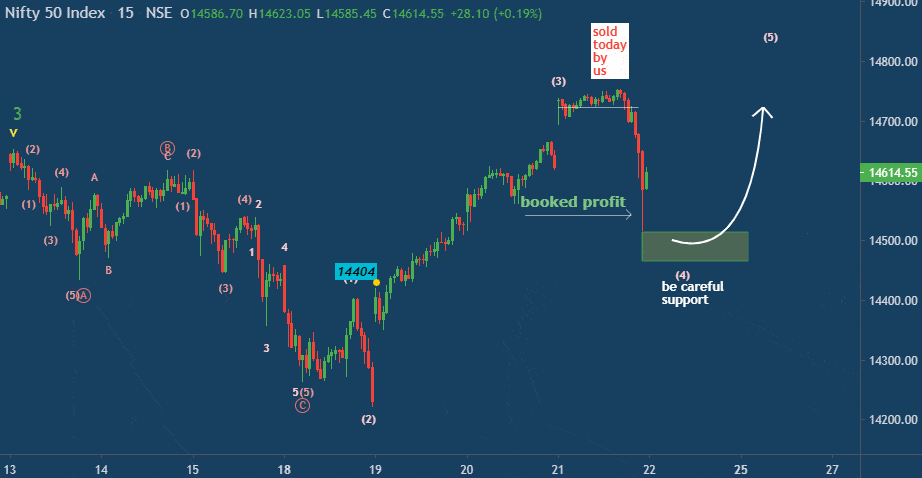
NIFTY Sell below 14719 for targets 14576 and stop-loss 14745
This trade was achieved by us.

Traded Level 14719, Target 14576, equals to 143 points profit and stop-loss only 26 point. The PROFIT is 10,725 just only in 1 lot sizeTo become a subscriber, subscribe to our free newsletter services. Our service is free for all.

RELIANCE:

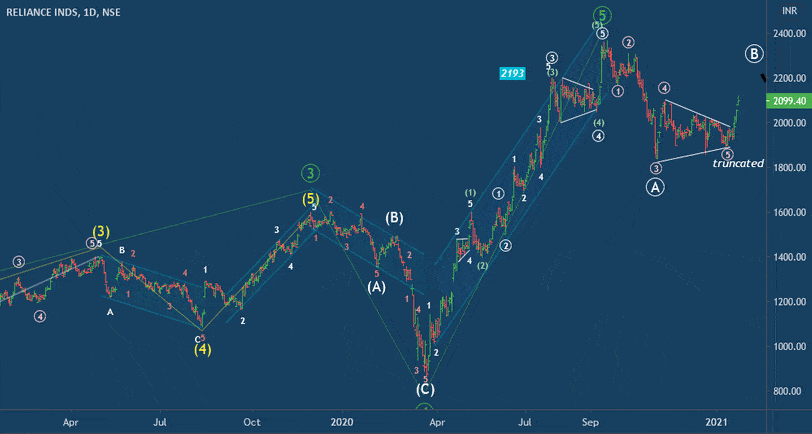
This stock price moving to 2193 and 2235 as target. As per the Daily chart the correction can be 2250-2230.

EW on Daily chart

EW on Weekly chart.

Continue reading

Parallel Channel and use of it over the NIFTY

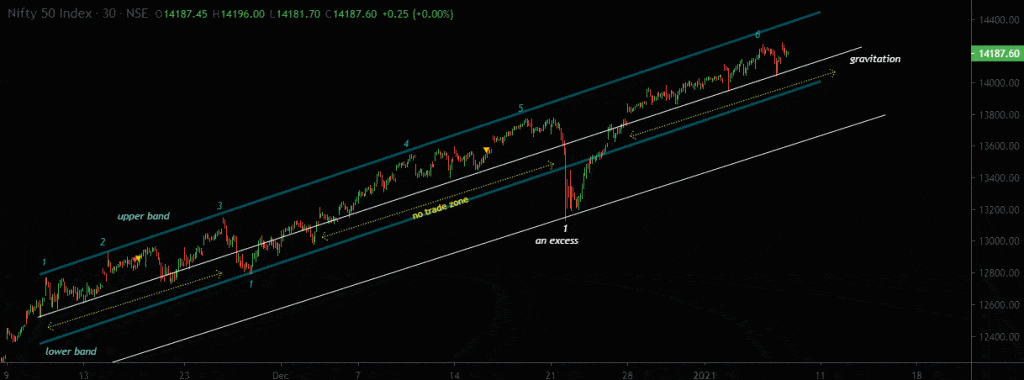
We found that a price is frequent spending more and more time between “Upper-Band” & “Gravitation line”. In other words, a price staying much of time between “Upper-Band” & “Gravitation line”.
Look at the upper-bank has 6 touches.
We are seeing no activities between the lower band and control price. That’s why we concluded that if price breakdown, gravitation line will be confirmation of fall. Yes, you can take profit from this type of trend by using buy at control price and sell at the upper band.

To become a subscriber, subscribe to our free newsletter services. Our service is free for all.

Continue reading

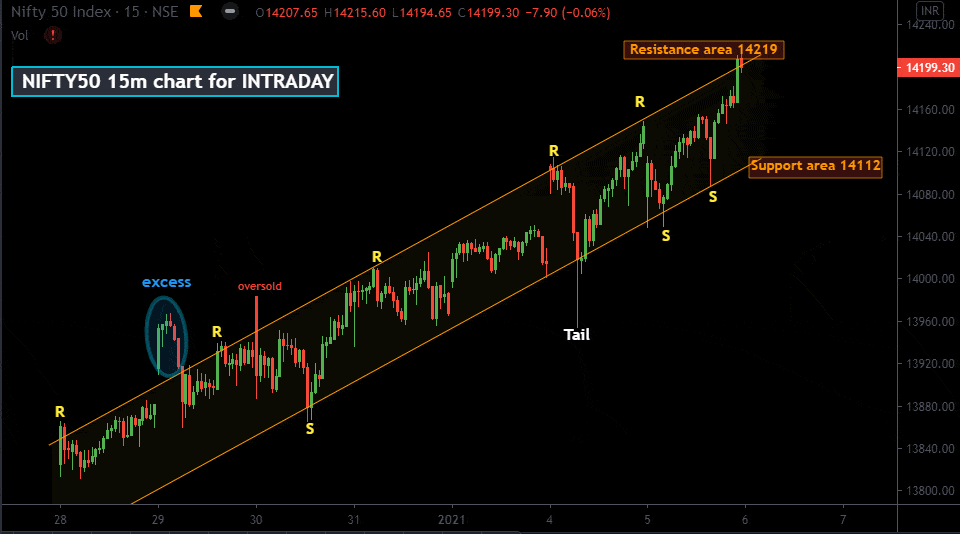
Short term view in NIFTY50 for INTRADAY

Intraday support 14112, Resistance 14219
INTRADAY traders can short their position for the target of 14118 nearby.

If there will be breakout and price will cross the main resistance level that is 14219 then nifty will be still much bullish as indicators are indicating.

TECHNICAL INDICATORS

Moving Averages – Bullish

Technical Indicator – Bullish

Moving Averages Crossovers – Bullish

To become a subscriber, subscribe to our free newsletter services. Our service is free for all.

Continue reading