How to find the next wave after the development of extended waves?
Two terms are important to understand for this Sample.
- Extended Wave – The biggest wave of three impulsive waves (W1, W3, or W5) for the motive phase. In this, we expect gaps, surged, sharp moves in it.
- Difference between points – A wave has two points, the starting and ending point. The distance between them is the difference between those points. For example, Wave 1 traveled from Rs. 30 points to Rs. 45 point. As a result, the difference between 45- 30 points is “15”.
The formula that we will use to find the 5th wave:
Difference of, 5th Wave = 3rd wave Extended – 1st Wave
(add this difference of 5th wave to the 4rth wave)
&
Difference of, 5th Wave = 3rd wave – 1st Wave Extended
(add this difference of 5th wave to the 4rth wave)
Formula when 5th Wave is extended:
Difference of 5th Wave = D. 1st Wave + D. 3rd Wave
(add this difference of 5th wave to the 4rth wave)
Let’s first check the chart of Maruti on a daily timeframe (March 2020-21):
Daily (Fig. 1.1 The price finding starting point of the IV wave)
At a minimum, waves V should carry prices above the 8991 rebound high in five distinct waves. The wave IV is subdividing, support labeling below 6923(.382 retracement of wave iii) is around 6639(Y=W) and then 6483(0.5 retracement of wave iii). Let’s use the formula for determining target,
The formula that we will use to find the 5th wave:
Difference of, 5th Wave = 3rd wave Extended – 1st Wave
(add this difference of 5th wave to the 4rth wave)
Wave V= Wave III(D.1602) Extended – Wave I(D.3670
= D.2068
Adding D.Wave V into Wave IV,
= D. Wave V (2068) + Wave IV (still not confirmed)
Therefore, we have to wait for confirmation of wave IV.
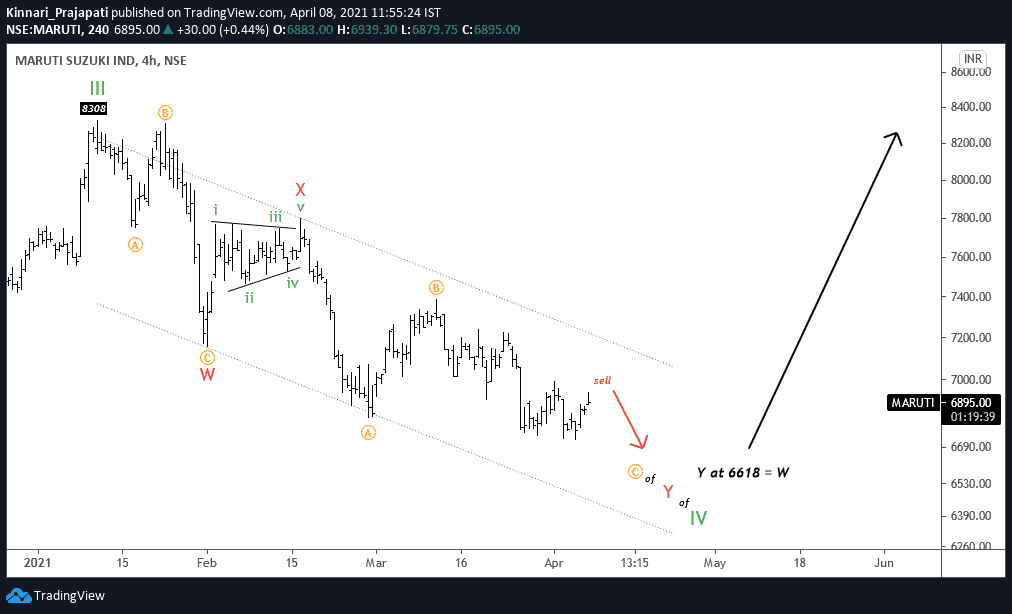
Let’s take a look at 4-hour TF cautiously for creating a sell setup:
4hrs (Fig. 1.3 selling setup with low risk and high reward of the IV wave)
I wouldn’t rule out the possibility that the”corrective zigzag wave Y lower side is in place. Therefore, the sell setup can be initial. The price can test 6600-6650 but, I need to reassess if the price can move 7218 above.
Sell Setup can be following:
 Unlock This Article
The wave counting on historical data.
4hrs (Fig. 1.4 selling setup with low risk and high reward of the IV wave)
There’s nothing new to add here.
The weekly chart from 2008-2021 (Fig. 1.4 The price is traveling for Wave Rounded Wave5)
The pullback from April 2020 counting as the wave is completed. The price(T-11793) is expected to complete the wave in the near term with an all-time high.
The formula that we will use to find the 5th wave:
Difference of, 5th Wave = 3rd wave Extended – 1st Wave
(add this difference of 5th wave to the 4rth wave)
Let’s apply it to Maruti;
Wave = D. R. Wave 3 (D.9096) Extended – R. Wave 1 – (D.1304
= 7792
Adding D. R. Wave 5 into R. Wave 4,
= D. R. Wave 3(7792) + R. Wave 4 (4001)
R. Wave 5= 11793
To become a subscriber, subscribe to our free newsletter services. Our service is free for all.
Get free important share market ideas on stocks & nifty tips chart setups, analysis for the upcoming session, and more by joining the below link: Stock Tips
Have you any questions/feedback about this article? Please leave your queries in the comment box for answers.