NSE JUBLFOOD: Falling And Moving Up

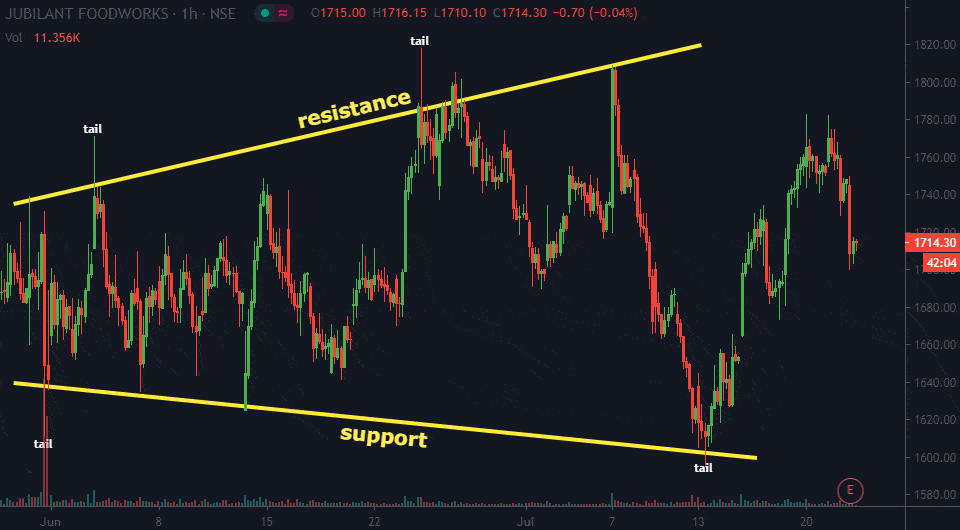
JUBLFOOD momentum is a good, it is trading in a middle of the disjoint channel.

At every support and resistance, it generally creates a tail.

After it takes its support and resistance the “falling and moving up” that momentum is great, and after taking support and resistance the stock has a minimum of 100 point moves.

As the stock is trading in the middle of a disjoint channel, it can oscillate between 1686 to 1774.

To become a subscriber, subscribe to our free newsletter services. Our service is free for all.

Continue reading
NSE RELIANCE chart analysis & Outlook

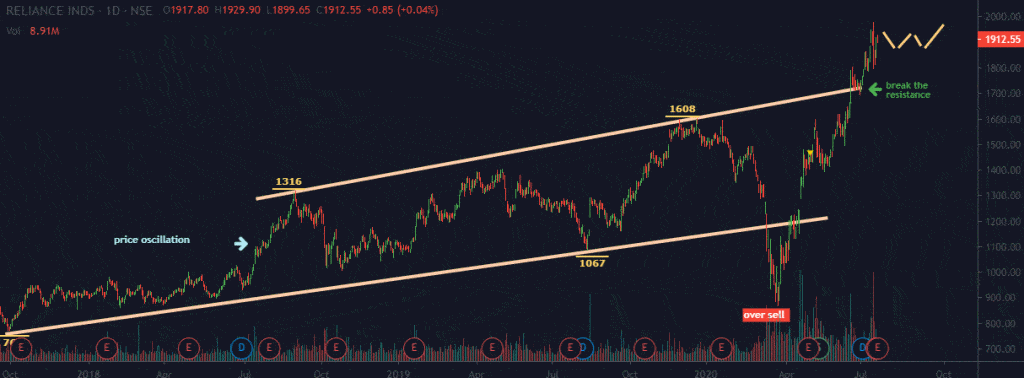
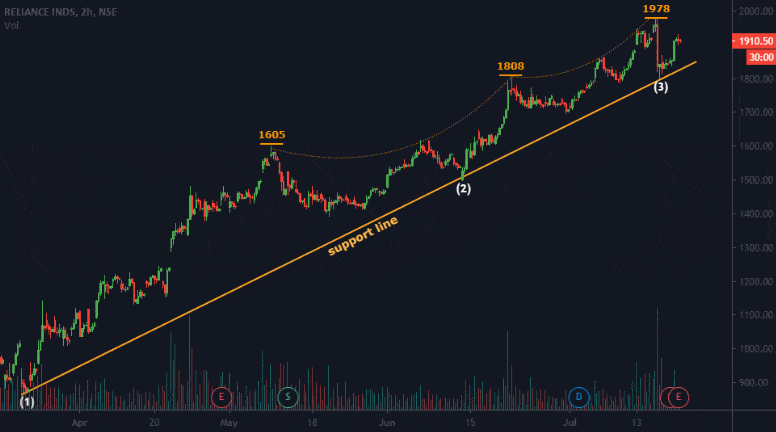
In daily chart stock had already broken its resistance and overall the stock is in bullish form.
It can be considered that the stock will oscillate in this price.

In smaller time frame one hour chart the stock movement is slow, but it is in the bullish form. So by keeping support level that is 1853 buy and stop-loss can be 10 point lower the support. Target can be near 1978.

To become a subscriber, subscribe to our free newsletter services. Our service is free for all.

Continue reading
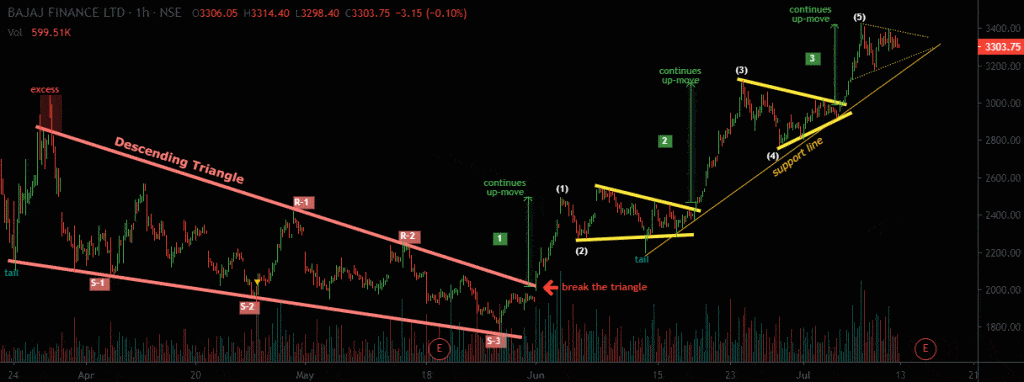
Bajaj Finance LTD Chart Analysis

Bajaj Finance has already formed a descending triangle
It has break its triangle in up-direction and now this stock is following an up-direction.
You can see in the chart I have mentioned “continues up-move”
after every continues up move, the stock always form a small triangle and there is a price rotation.
The stock has taken perfectly it’s support every-time.

To become a subscriber, subscribe to our free newsletter services. Our service is free for all.

Continue reading
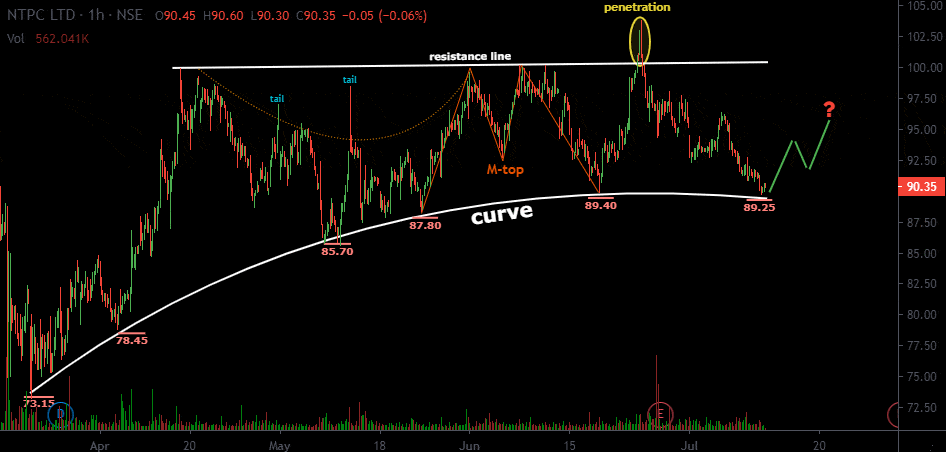
NTPC trade approach For Traders

The stock is trading near the support of curve line.
It has already formed a M-top pattern that is double top.
The stock is trading in between 100 and 90 price.

To become a subscriber, subscribe to our free newsletter services. Our service is free for all.

Continue reading
INFY modernize plan explication

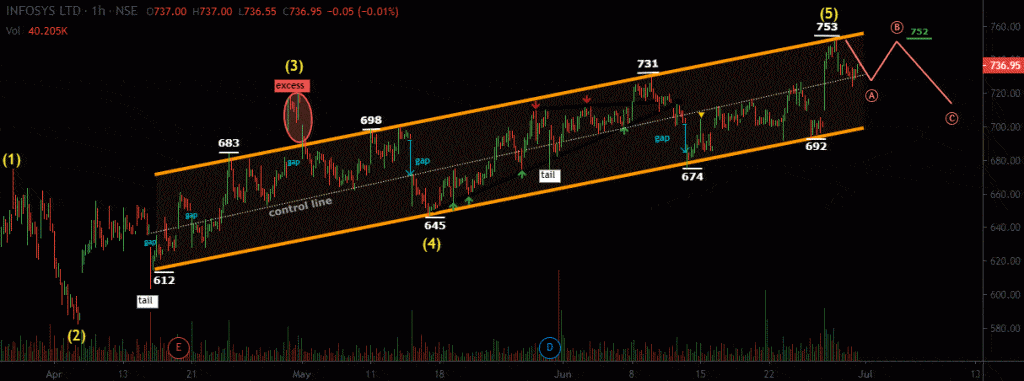
On INFY there is a perfect channel is formed. The stock is revolving between the channel.
Price is currently near the control line. It is expected to move from the current level to 752 price point, that is till B point.

Below 723 price can be bearish.

To become a subscriber, subscribe to our free newsletter services. Our service is free for all.

Continue reading

Analysis on TATAMOTORS For Subscribers

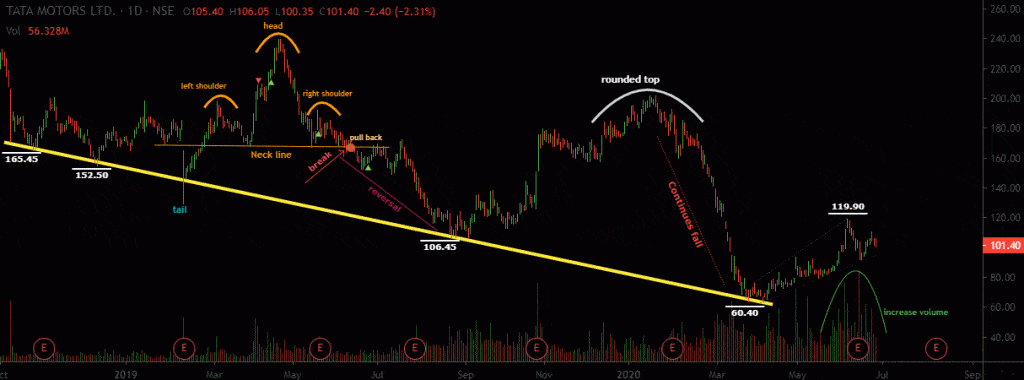
The stock is following Long move downwards.
Head and shoulder pattern is formed between 8 Feb 2019 to 14 jun 2019, 82 bars.
After the pattern formed there was 61 point reversal that is from 167 price slop down to 106.

TATAMOTORS followed with rounded top and there was a continues fall that is stock has reversed from 202 to 63 equal to 139 point reversal.

Now TATAMOTORS is forming a disjoint channel 23 mar 2020 till now
There is increase in volume fluctuation.
Support near 93.50
Below 87.32 bearish

To become a subscriber, subscribe to our free newsletter services. Our service is free for all.

Continue reading