I spend much of my spare time analyzing markets as many of you know. Yes, analysis is my day job, but it is also my passion. So, whenever the weekend comes around, I spend most of my time studying price charts in front of the computer. Though was looking for the swing trade setup for F&O NSE, At a lower timeframe I found Ending-Diagonal on IGL which is a highly reliable one of 13 patterns for R.N Elliott. So I decided to explain it.
The trend identifying Monthly Line-Chart on Log-Scale

Because of line chart simplicity, we’re just looking to identify the trend purpose which is a clear visualization of the primary trend. A popular trading expression is “the trend is your friend.” Therefore, your long(buying) side trade will be referred to as the main or primary trade setup.
The Monthly bar-chart Log-Scale for more clarity on what is going on inside up-trend and its up-down personality.

The bar-chart Log-Scale for more clarity on what is going on inside up-trend.
The support is still too far at or near the lower boundary line at the parallel price channel but Sometimes, the middle line would work as support also. This is essentially what I work with support at the bottom line or middle line. A price is near the middle line or a little below it that is why I would like to create a long trade-set-up.
Don’t ignore this outcome from the bar-chart: A trend is a downside in the range of parallel channels.
Before getting started to apply the wave principle, let’s look up previous significant support & resistance at the Monthly Arithmetic Scale.

In a technical analysis term “Flip Range” refers to the small price range that dramatically changes its direction and touches it repeatedly.
A Significant “Flip Range”: 345 to 364 where I am going to create a long setup for a pullback.
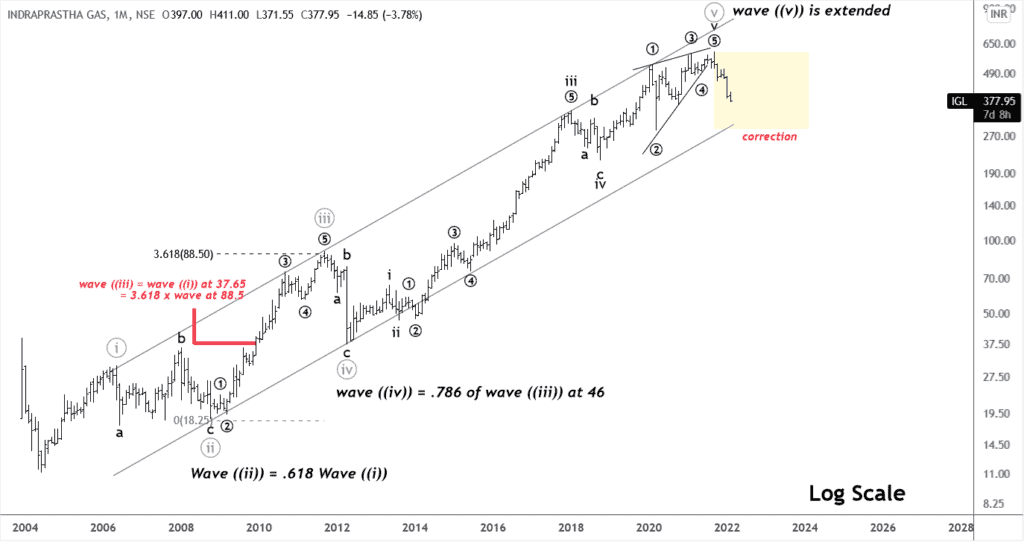
The wave principle is applied on IGL at the monthly log-scale time frame.

As you can see in the price chart, I labeled using Elliott wave principles and recognized that a price is trading in the corrective mode. More importantly, the wave ((ii)) is exactly 61.8% multiple & wave ((iii)) is just beyond the 3.618 extended ratios but wave ((iv)) is deeper at 78.6% which is not a common or expected ratio on a log scale. A wave ((v)) is an extended wave.
Let’s jump on the 2-Days time frame for clear visualization of the Ending Diagonal.

- Therese important support for pull-back – 366-64/351 & 284.
- A sharp correction has occurred after the Ending Diagonal is terminated.
- The Ending Diagonal is a terminating wave pattern.
In real-time trading, I’ll create trade-setups utilizing the above supports. For instance, I’ll look for a pullback entry in the price range from 344 to 364 long side but during the trading hours, I always focus on price action to take action.
To take action 4-hours chart at regulate scale:
 Unlock This Article
To become a subscriber, subscribe to our free newsletter services. Our service is free for all.

Get free important share market ideas on stocks & nifty tips chart setups, analysis for the upcoming session, and more by joining the below link: Stock Tips
Have you any questions/feedback about this article? Please leave your queries in the comment box for answers.