Free Stock market / Nifty intraday tips, FREE Stock, Commodity & Forex tips

Is NSE PRECWIRE Preparing For A New High?

nse precwires chart calls

nse precwires chart calls

Timeframe: Daily

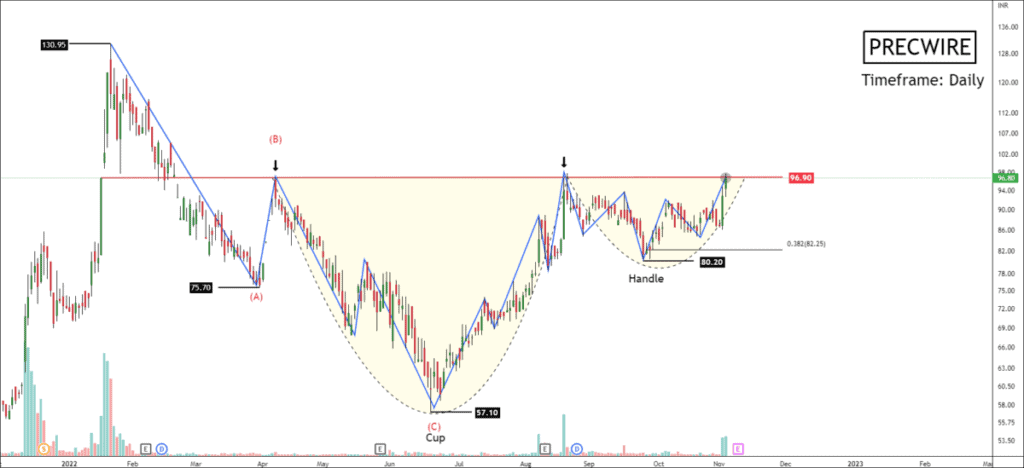
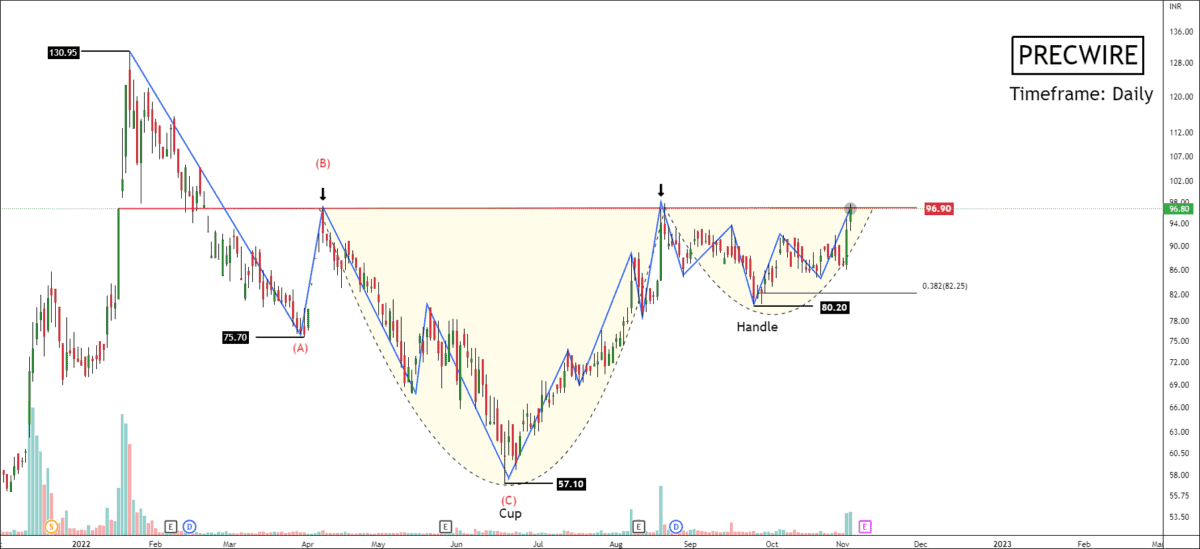
After making a high of 130.95, NSE PRECWIRE has started forming correction. Wave C extended 161.8% of wave A. RSI of the price is above 65, and the stock is trading above 200 EMA.

The price has been trading above the average volume line for more last two trading sessions. The volume has confirmed the trend. Recently, the rally tried to break down the supply level of 96.90, but the price couldn’t break out the corrective structure.

PRECWIRE has formed inverted hammers & cups and handles pattern daily timeframe chart, But the price has to commit to the movement before we commit to the price. If the price breaks out and sustains above 96.90, traders can trade for the following targets: 100.2 – 116.65 – 126.6+.

Additionally, this level is crucial to confirm future wave projection because a new trend can only begin after wave B/2/X breaks. Failure may set a bearish momentum and lead to the following targets: 90.70 – 86.55 – 81.65.

I will update further information soon. To become a subscriber, subscribe to our free newsletter services. Our service is free for all.

Get free important share market ideas on stocks & nifty tips chart setups, analysis for the upcoming session, and more by joining the below link: Stock Tips

Have you any questions/feedback about this article? Please leave your queries in the comment box for answers.

Disclaimer: The information provided on this website, including but not limited to stock, commodity, and forex trading tips, technical analysis, and research reports, is solely for educational and informational purposes. It should not be considered as financial advice or a recommendation to engage in any trading activity. Trading in stocks, commodities, and forex involves substantial risks, and you should carefully consider your financial situation and consult with a professional advisor before making any trading decisions. Moneymunch.com and its authors do not guarantee the accuracy, completeness, or reliability of the information provided, and shall not be held responsible for any losses or damages incurred as a result of using or relying on such information. Trading in the financial markets is subject to market risks, and past performance is not indicative of future results. By accessing and using this website, you acknowledge and agree to the terms of this disclaimer.
Previous ArticleNext Article
Mr.Guru(s) is a team of stock market certified technical and research analysts with over 20 years of experience. They are regular guests on popular online channels and contribute articles to several financial publications. Their insights and advice are respected by investors worldwide. With their collective knowledge and expertise, they have a proven track record of successfully predicting market movements and identifying profitable opportunities.

Join Today (Free): Stock & Nifty Tips

5 Comments

  1. Thank you for sharing this chart. You have good grip in stock research. Can you analyse nifty on short term basis?

  2. Sir nifty exactly same chal rahi he jaise apne projection kiya he. eagerly waiting for your next update.

Write a Comment

Comment Policy: We love comments and appreciate the time that readers spend to share ideas and give feedback. However, all comments are manually moderated and those deemed to be spam or solely promotional will be deleted. Your email address will not be published. Required fields are marked *