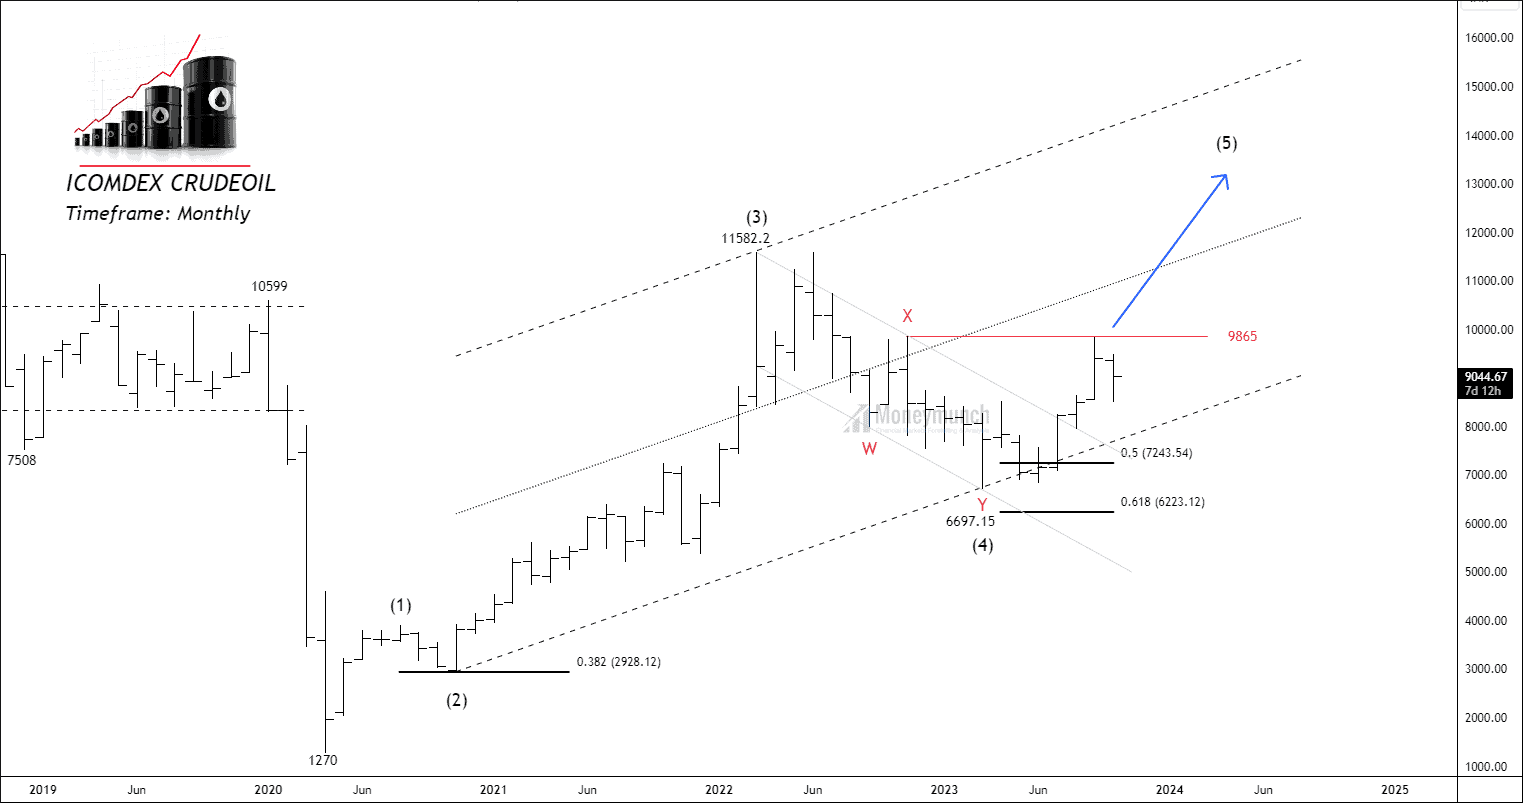
Free Stock market / Nifty intraday tips, FREE Stock, Commodity & Forex tips

ICOMDEX & MCX CRUDEOIL – Bigger Picture Analysis

Free nse mcx crudeoil chart calls

Free icomdex crudeoil chart tips

Timeframe: Monthly

It is the ICOMDEX monthly timeframe chart where the price has started a new impulsive cycle from the low of 1270. The price has broken out 20 & 50 Exponential moving averages. RSI is snowing bullish momentum with a 56.97 level.

Wave formation and Fibonacci relationships:

  • Wave (2) retraced 38.2% of wave (1)
  • Wave (3) is a power-extended wave with 3.618% Fibonacci extension.
  • Wave (2) is trading above the starting point of wave (1)
  • Wave (4) retraced 61.8% of wave (3)
  • Wave (4) hasn’t entered the price territory of wave (1) and has formed a complex correction of W-X-Y.

Crude oil has accomplished the complex correction and marked evidence by breaking the descending channel of the corrective structure. According to the Elliott wave principle, an impulsive cycle can only be confirmed by breaking out the sub-wave X of the previous correction. If the price breaks out wave X, traders can see the following levels: 10550 – 11500 – 12744+. Not having confirmation will be the confirmation of the continuation of the corrective phase.
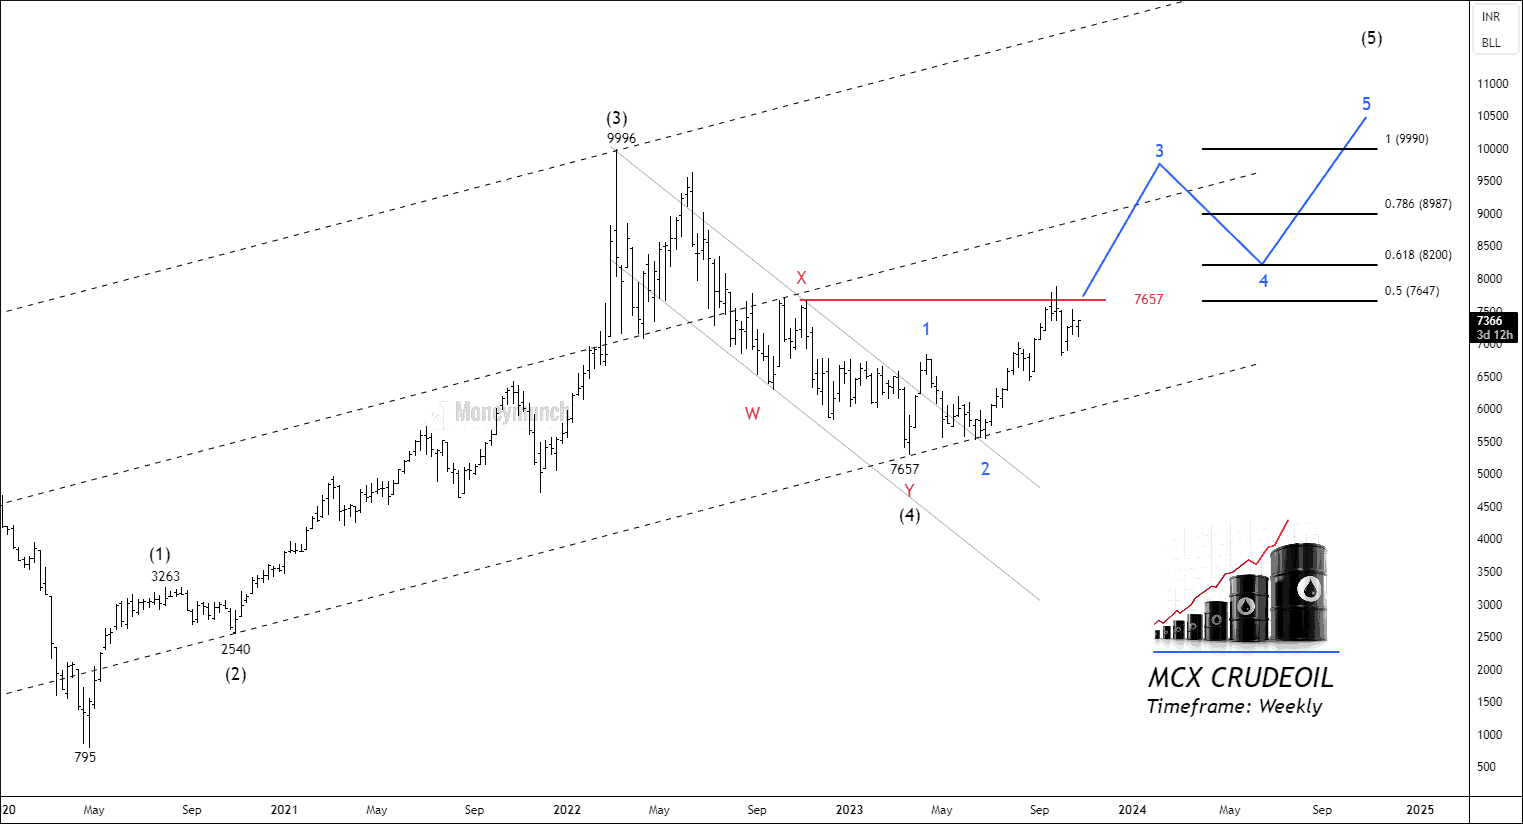
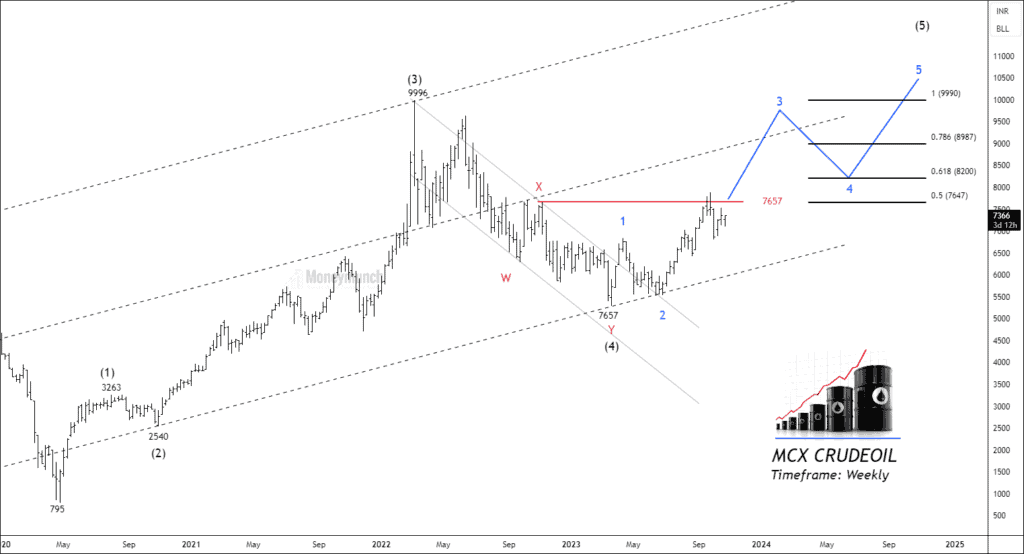
Free nse mcx crudeoil chart calls

Timeframe: Weekly

As we can see on the above chart, we are getting a similar structure, and mainly the confirmation. ICOMDEX & MCX CRUDE OIL can be a comrade to confirm each other, just like we used to compare Dow Jones with other indices.

If the price breaks out 7657, traders can trade crude oil for the following targets: 8200 – 8950 – 9950+. We still need to look at the lower timeframe to connect the worm’s-eye view(Micro picture) with the given eagle view.

We will update further information soon.

Get free MCX ideas, chart setups, and analysis for the upcoming session: Commodity Tips

Have you any questions/feedback about this article? Please leave your queries in the comment box for answers.

Disclaimer: The information provided on this website, including but not limited to stock, commodity, and forex trading tips, technical analysis, and research reports, is solely for educational and informational purposes. It should not be considered as financial advice or a recommendation to engage in any trading activity. Trading in stocks, commodities, and forex involves substantial risks, and you should carefully consider your financial situation and consult with a professional advisor before making any trading decisions. Moneymunch.com and its authors do not guarantee the accuracy, completeness, or reliability of the information provided, and shall not be held responsible for any losses or damages incurred as a result of using or relying on such information. Trading in the financial markets is subject to market risks, and past performance is not indicative of future results. By accessing and using this website, you acknowledge and agree to the terms of this disclaimer.
Previous ArticleNext Article
Mr.Guru(s) is a team of stock market certified technical and research analysts with over 20 years of experience. They are regular guests on popular online channels and contribute articles to several financial publications. Their insights and advice are respected by investors worldwide. With their collective knowledge and expertise, they have a proven track record of successfully predicting market movements and identifying profitable opportunities.

Join Today (Free): Stock & Nifty Tips

Write a Comment

Comment Policy: We love comments and appreciate the time that readers spend to share ideas and give feedback. However, all comments are manually moderated and those deemed to be spam or solely promotional will be deleted. Your email address will not be published. Required fields are marked *