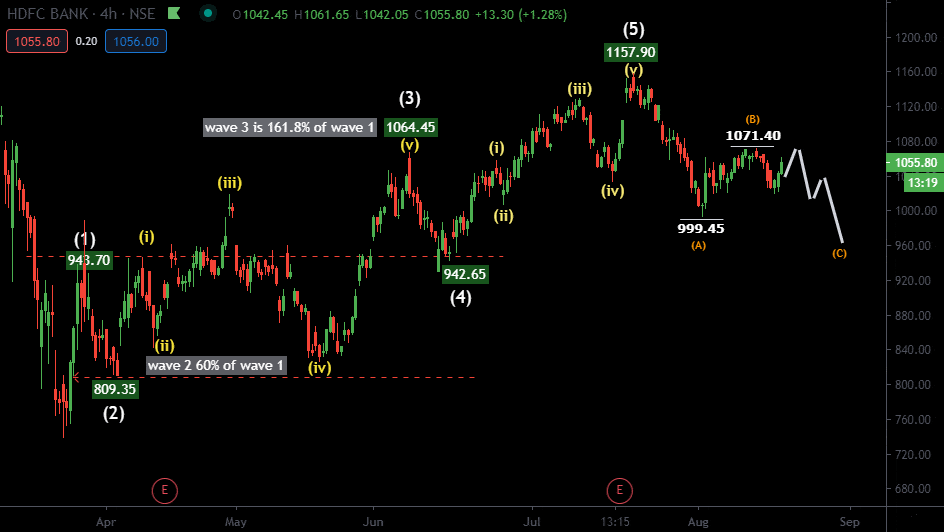
After forming a higher-high the stock has made next peak lower Presently if the stock move above 1071 it can be still bullish.
Wave 4 was finish at 942.65, Wave 5 is 0.78% of wave 4. In wave 5 mentioned a sub-wave with roman latter. A is retraced the range at 100% to1.61% of wave 5.
Wave b is 61.8% of wave A.
Wave 4 can not overlap wave 1, but sometimes it overlaps still follow Elliott wave theory, wave 2 can never exceed the start of wave 1.
Information on Elliott waves trading analysis to read click here
To become a subscriber, subscribe to our free newsletter services. Our service is free for all.
Get free important share market ideas on stocks & nifty tips chart setups, analysis for the upcoming session, and more by joining the below link: Stock Tips
Have you any questions/feedback about this article? Please leave your queries in the comment box for answers.

Good work on HDFC bank with Elliott wave theory, I like to trade with Elliott wave.
Very accurate analysis ma’am, good work keep it up.
nice analysis! I will definately track this stock and try to catch the correction! thanks for notification :)
Always looking for stocks which evolve nicely to EW-theory :)
I follow your last some instructions and I notice that your instructions is very strong and trustable.
Hello,
Vishika here, I am trader and I take away my trading at last some months and now I want to restart my trading so i nees your subscription.
Thank you
I have seen your chart yesterday and I have sold HDFCBANK stock and now I am in profit,
Thanks for share with me your view
I am 42 year old and I have started my trading when I am 30 year old, but I have loss my money because of analysis, I have seen your charts that is amazing work I wish to work with you, so now I want your service
Thanks for sharing with me your view on HDFC bank. I think Elliott wave has very accurate.
Wow! I like your analysis skills, and I like to want your service.