


Timeframe: Daily
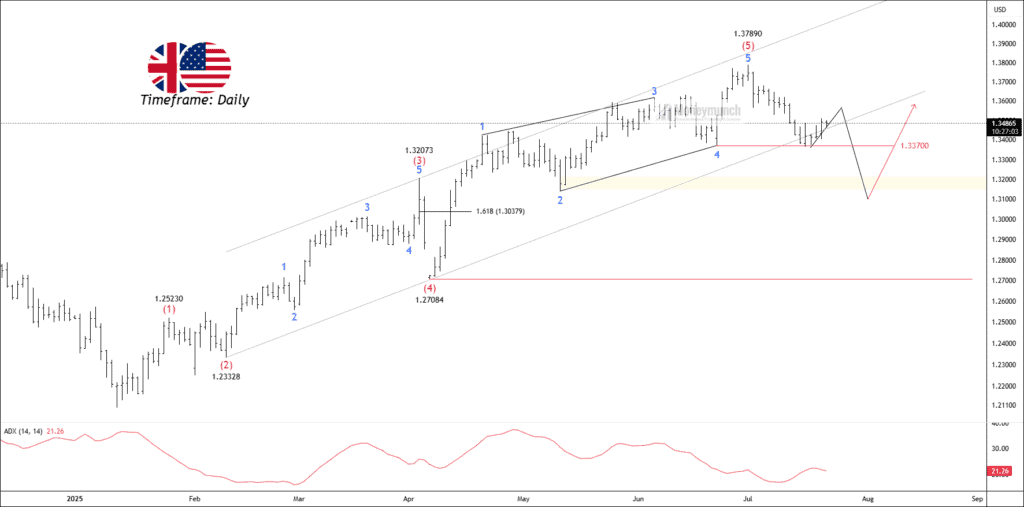
The GBP/USD daily chart shows a completed five-wave impulse pattern that started from the 1.23328 low (marked as wave (2) and peaked at 1.37890 (wave (5)). The entire structure is clearly nested within a well-respected ascending channel. The third wave (red) extended significantly, with its 1.618 Fibonacci projection around 1.30379 acting as a key support area during the impulsive advance. The corrective waves 2 and 4 both retraced modestly, keeping the bullish momentum intact. The wave (5) high at 1.37890 now stands as a significant resistance level, from where price has started pulling back.
Currently, the market appears to be unfolding a potential corrective phase, possibly an ABC zigzag. Price is hovering near the lower channel support and the key horizontal level around 1.33700. If this level breaks decisively, the pair may drop toward the highlighted support zone near 1.3100–1.3150 before starting a new bullish leg. This area aligns with previous structure and would complete the correction. As long as the price holds above 1.27084 (wave (4) low), the overall bullish structure remains valid. The ADX is low, indicating weak trend strength, which supports the idea of ongoing correction before the next impulsive wave higher.
Only premium members will receive trade setups including entry, exit, and invalidation levels.
Get free forex & currency ideas, chart setups, and analysis for the upcoming session: Forex Signals →
Want to get premium trading alerts on GBPUSD, EURUSD, USDINR, XAUUSD, etc., and unlimited access to Moneymunch? Join today and start potentially multiplying your net worth: Premium Forex Signals
Premium features: daily updates, full access to the Moneymunch #1 Rank List, Research Reports, Premium screens, and much more. You΄ll quickly identify which commodities to buy, which to sell, and target today΄s hottest industries.
Have you any questions/feedback about this article? Please leave your queries in the comment box for answers.

Really impressive effort!
You nailed it
You’ve explained everything perfectly.