ALGOUSD Poised to Ignite Wave (5)

RESEARCH REPORT – MCX SILVER, GOLD & NATURAL GAS
MCX SILVER – Bull Victory
Did you take a trade based on the MCX Silver price action breakdown?
Click here: MCX Silver: The Path to 1,11,000 or a Dip to 80,000?

We had written clearly, “Short-term targets could be 95960-98160-99600. After the breakout, we can see a massive move up to 1,11,000“.
Timeline:
[16 April 2025]
- 12:45 PM: Price hit the first target of 95960.
[29 April 2025]
- 02:00 PM: Price reached the second target of 98160.
[2 June 2025]
- 06:45 PM: Silver touched the second target of 99600.
[18 June 2025]
- 02:25 PM: Price made a new high of 109,692.
[11 July 2025]
- 11:00 AM: MCX SILVER hit the final target of 1,11,000.
If you have traded this setup, you could have accumulated more than 18,000 points.
MCX Natural Gas – Is Wave (E) Bottoming Out?

BTCUSD – Bull Victory
Did you trade the BTCUSD Wave Setup?
Visit here: The Grand Finale: BTCUSD’s Final Wave (5) Taking Shape
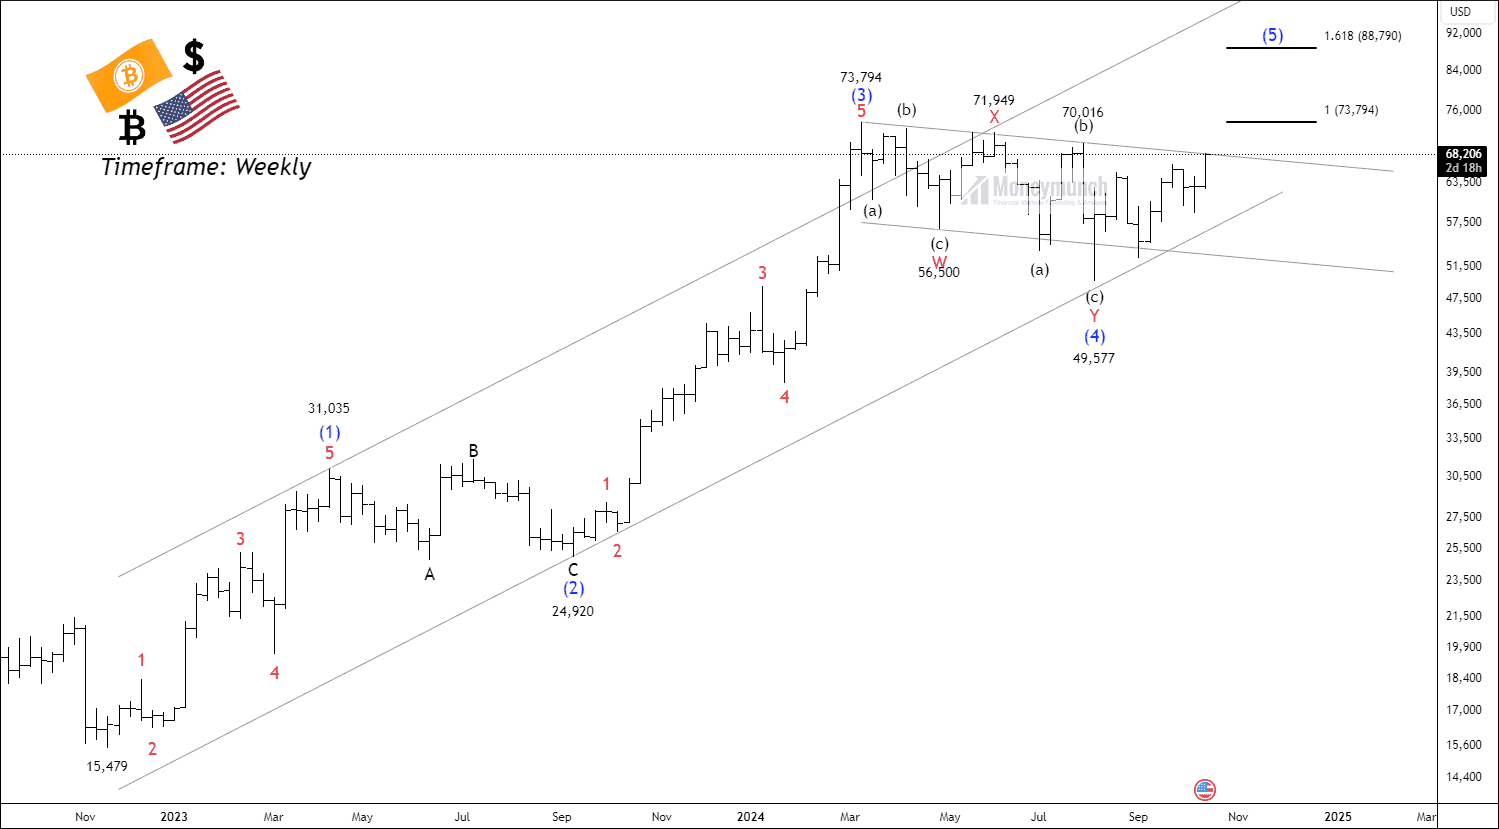 BEFORE
We had written in clear words, “The potential targets extend up to 88,790, which corresponds to the 161.8% Fibonacci extension of wave (4).”
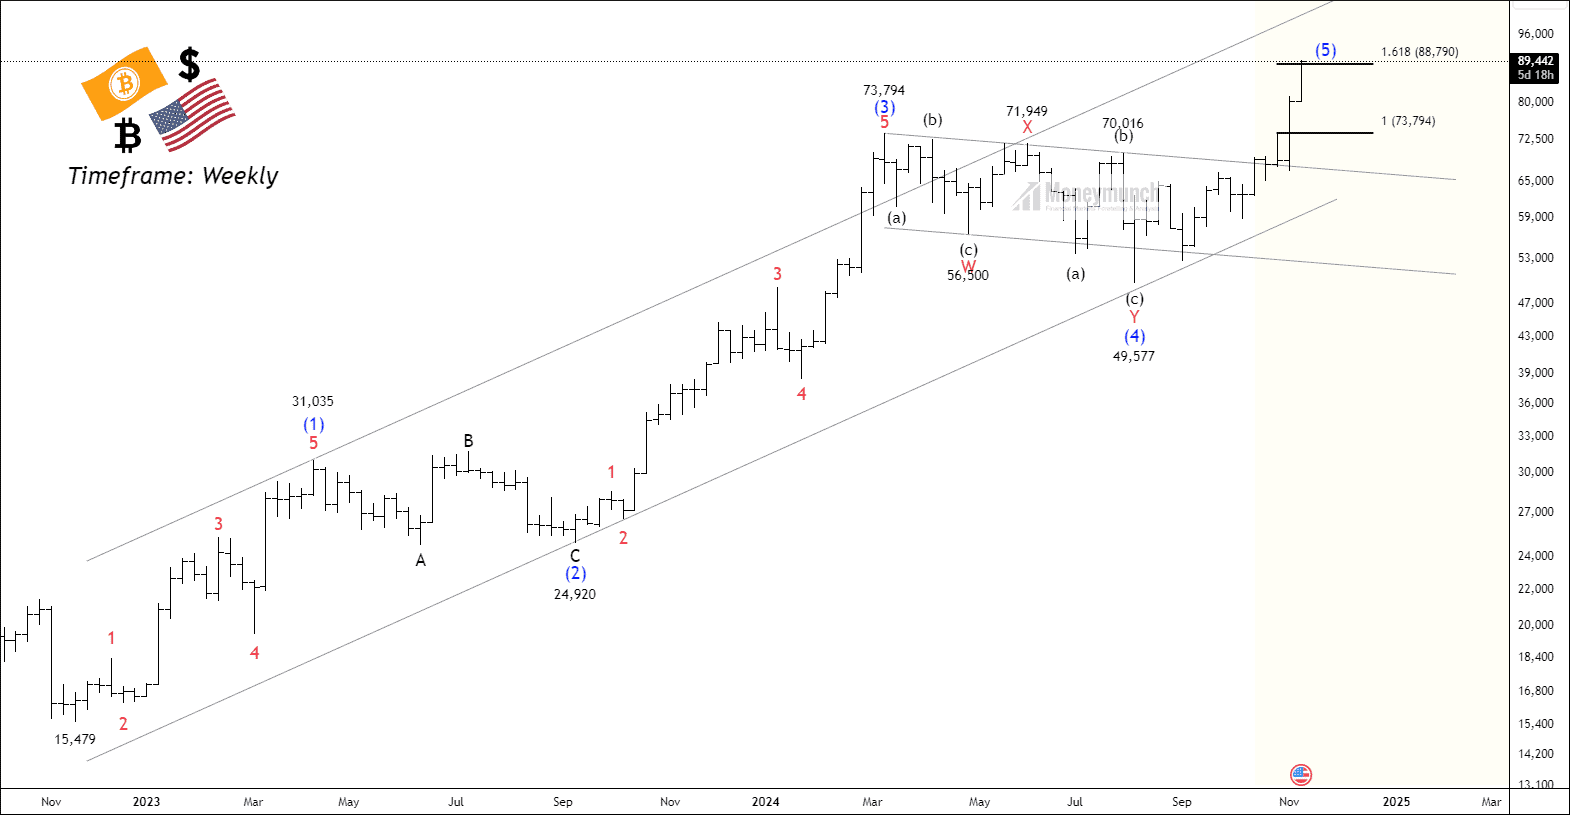 AFTER
AFTER