Get free MCX ideas, chart setups, and analysis for the upcoming session: Commodity Tips →
Have you any questions/feedback about this article? Please leave your queries in the comment box for answers.
Disclaimer: The information provided on this website, including but not limited to stock, commodity, and forex trading tips, technical analysis, and research reports, is solely for educational and informational purposes. It should not be considered as financial advice or a recommendation to engage in any trading activity. Trading in stocks, commodities, and forex involves substantial risks, and you should carefully consider your financial situation and consult with a professional advisor before making any trading decisions. Moneymunch.com and its authors do not guarantee the accuracy, completeness, or reliability of the information provided, and shall not be held responsible for any losses or damages incurred as a result of using or relying on such information. Trading in the financial markets is subject to market risks, and past performance is not indicative of future results. By accessing and using this website, you acknowledge and agree to the terms of this disclaimer.
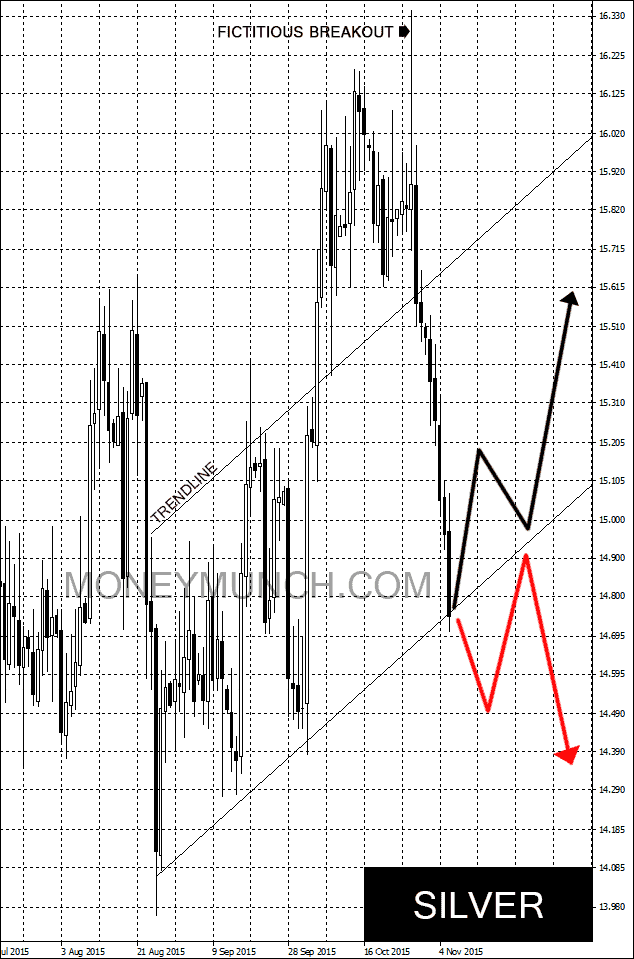
Look at the above silver daily chart, there’s right arrow clearly indicating fictitious break of the silver and on the next day it broke trend line & closed below it. That’s why we have seen big downfall.
Now if silver close above the 14.815 level then we will see 15.100-15.400+ levels. And if it makes 1-2 down candle, then it will follow red line big arrow and hit 14.500-14.400-14.300 below levels.
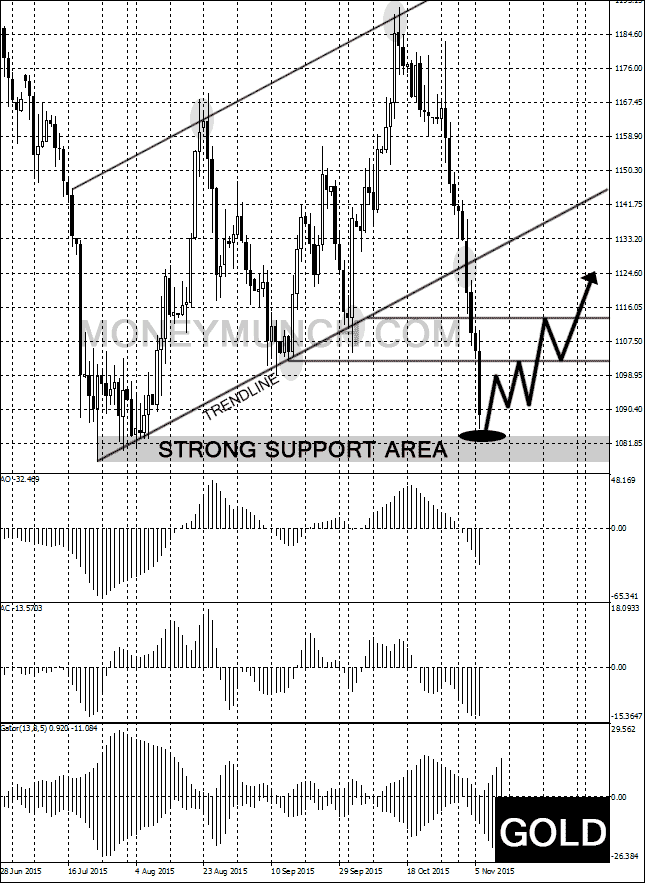
If you’re a long-term buyer, then you must wait or keep patience!
More information and live buy / sell soon.
To become a subscriber, subscribe to our free newsletter services. Our service is free for all.

Unlock This Article
Only subscribers can read the full article. Please
login to read the entire article.
Thank you sir its very informative you are really a guru