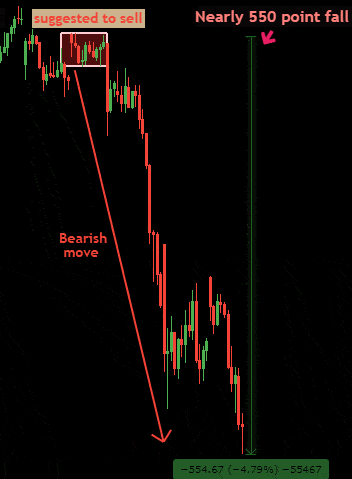
Have you remember NIFTY50 analysis if not -> CLICK HERE TO SEE
Hope all our members are enjoying our analysis.
To become a subscriber, subscribe to our free newsletter services. Our service is free for all.
Get free important share market ideas on stocks & nifty tips chart setups, analysis for the upcoming session, and more by joining the below link: Stock Tips
Have you any questions/feedback about this article? Please leave your queries in the comment box for answers.
Disclaimer: The information provided on this website, including but not limited to stock, commodity, and forex trading tips, technical analysis, and research reports, is solely for educational and informational purposes. It should not be considered as financial advice or a recommendation to engage in any trading activity. Trading in stocks, commodities, and forex involves substantial risks, and you should carefully consider your financial situation and consult with a professional advisor before making any trading decisions. Moneymunch.com and its authors do not guarantee the accuracy, completeness, or reliability of the information provided, and shall not be held responsible for any losses or damages incurred as a result of using or relying on such information. Trading in the financial markets is subject to market risks, and past performance is not indicative of future results. By accessing and using this website, you acknowledge and agree to the terms of this disclaimer.

Price is god. It discounts everything every news or anything. Even institutional investors depend on the price and technical along with fundamentals
interesting observation, appreciate if you could share more analysis like this details.
finally someone who speaks some sense last all update are very appreciating i want to subscribe thanks for great analysis
you were right, perfect prediction yes this is called stock market and pro guidance.
you do realize that institutions do loose money. The only difference is govt bails them out when they bet on wrong side.
Once you become a master in Demand and supply you can have some idea of what the institutions are doing. Technical analysis can’t go wrong
great great great i am so haapy by your analysis i got a good amount of profit 30000 although i did not hold for much time but i am so satisfied thanks for free service i will subscribe today only
OMG!! so interesting and exciting 550 point fall i missed this good chance of trading
Super , duper analysis Mam. Price is near to your target price. i am holding the short position and waiting for this week for final target
As chart are indicating a selling pressure… so whether it will sustain its bull move till 11325 or not as today’s high was 11015.
Amazing work done!! I liked the simplicity in the chart! Keep this up!!
Nice and clean idea :)
As long as we hold this, this could be support for now. There may be wicks below to capitulate on, but as long as the closes stay inside that trade.
good chart, agree bearish short term
Agree. I think prices are more likely to retest 10,500 level before moving higher.
Great Chart thanks for the work
Warren buffet predicted a crash(global slowdown) this might be a big consideration..
do you think weight should be given to the 10489 CME gap filling? I’m not sure what weight if any to give it. Appreciate your analysis here!
This exactly what’s on my mine, I strongly belief it will go below 10300 before ATH
it may be probably close this year below 10300
wait bearish before buy long, obviously now all the market were getting bearish due to second wave of pandemic and election. some might take off the stock for reducing the cost of annual tax.
Trend reversal is coming soon. Nice work.
So, it is quite likely that we will have a pullback soon.
You are carrying amazing knowledge, and you have brilliant ideas. Not only me, maybe 100s of thousands of people might be gaining from your Ideas, keep up good work.
Hi,
This is Karthick Duraisamy.I am just beginner or stock market and trading. without proper knowledge i trade and lost amount,,can u give the guidance .i can start trading safely.