
In the last update was 17th Feb, 2016, Nifty followed acculturated our level and chart path. It started to fall from high of previous of yesterday as 7252.
CLICK HERE PAST RESEARCHED ON NIFTY
We clearly mentioned 7248 to 7271 will change the direction of market.
Just compare last researched chart and present.
What is next?
7169 to 7144 is resistance for intraday only if trend is really bearish, then Nifty will close 7095 below. We can see fall of 6832-6798 very soon…!
Just look up S&P 500 chart and next level…
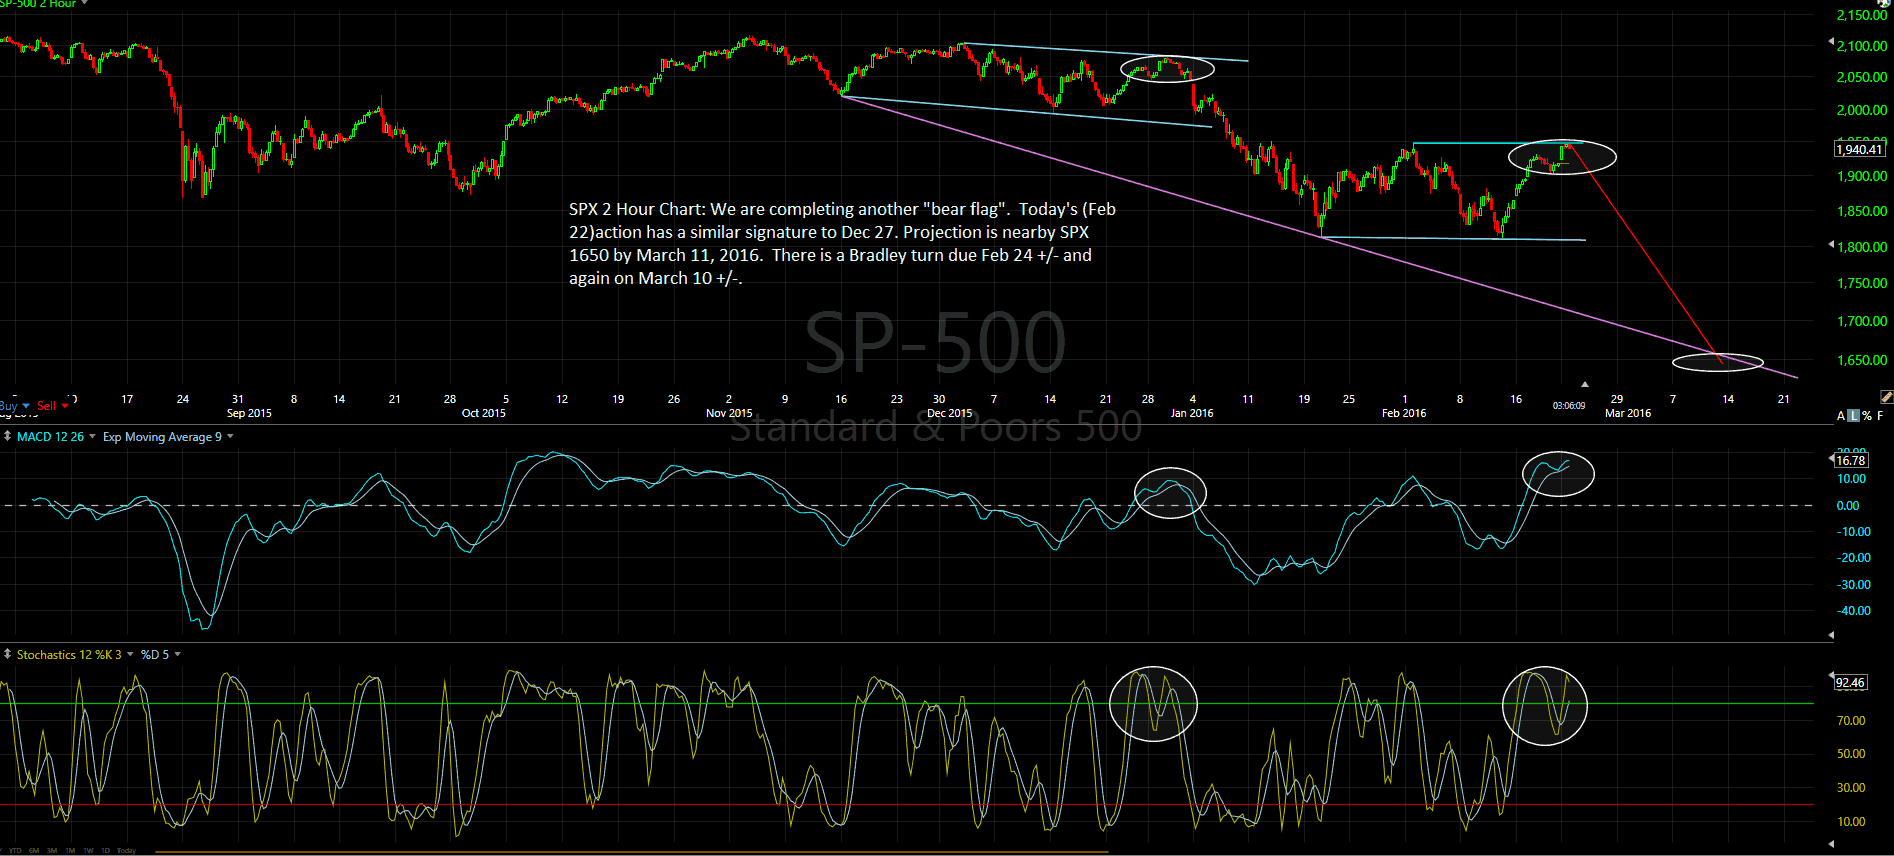
The chart below shows that the SPX 1650 level +/- may be next, and sooner than most think. Looking at this 2 hour chart of the SPX, we can see a similarity to the December 27, 2015 top. The move up from February 19 into February 22 is stronger by 27.7% suggesting a harder move down this time than in late December into January 20th.
To become a subscriber, subscribe to our free newsletter services. Our service is free for all.
Get free important share market ideas on stocks & nifty tips chart setups, analysis for the upcoming session, and more by joining the below link: Stock Tips
Have you any questions/feedback about this article? Please leave your queries in the comment box for answers.
Disclaimer: The information provided on this website, including but not limited to stock, commodity, and forex trading tips, technical analysis, and research reports, is solely for educational and informational purposes. It should not be considered as financial advice or a recommendation to engage in any trading activity. Trading in stocks, commodities, and forex involves substantial risks, and you should carefully consider your financial situation and consult with a professional advisor before making any trading decisions. Moneymunch.com and its authors do not guarantee the accuracy, completeness, or reliability of the information provided, and shall not be held responsible for any losses or damages incurred as a result of using or relying on such information. Trading in the financial markets is subject to market risks, and past performance is not indicative of future results. By accessing and using this website, you acknowledge and agree to the terms of this disclaimer.