
Timeframe: 4h
Overview:
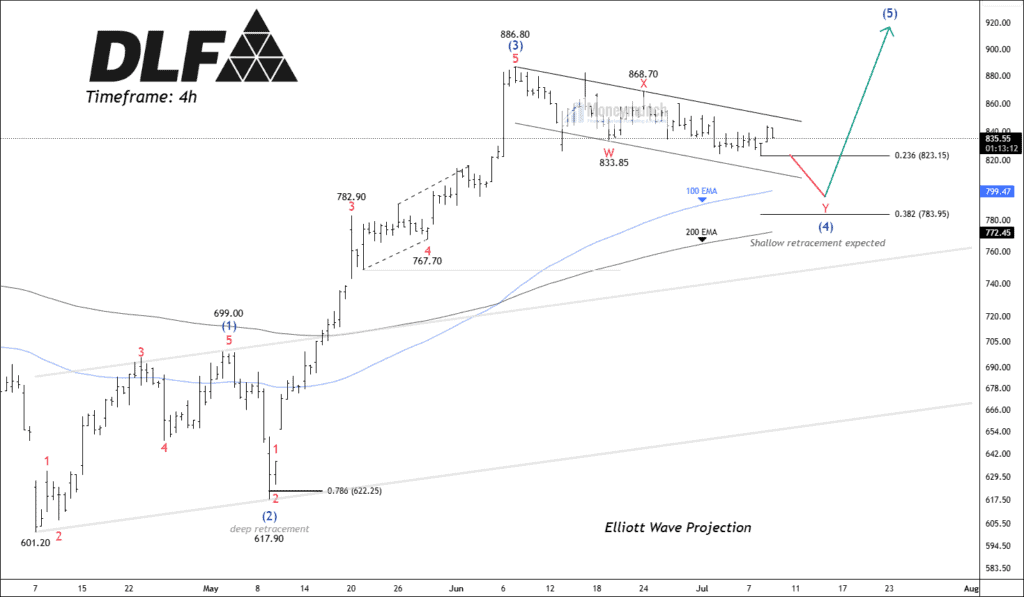
After hitting a low of 601.20, NSE DLF began an impulsive upward phase. Within this phase, wave (3) extended significantly, reaching a high of 886.80. Currently, the price action is unfolding in a double-three complex corrective structure. The ongoing wave (4) correction has retraced approximately 23.6% of the length covered by wave (3). Earlier, wave (2) had retraced deeply, reaching the 78.6% level at 622.25. Once wave (4) is complete, traders may look forward to a fresh upward move, with the following levels likely to act as potential targets: 840 – 868 – 881+. Traders willing to take short-term risks have a window to enter sell positions, aiming for a target no lower than 790, with strict risk management in place.
Wave (2) Characteristics:
- Retraced more than 78.6% of wave B.
- The structure was a deep, sharp, and strong zigzag.
- It followed the typical A-B-C corrective pattern, indicating a swift and impulsive retracement.
Implication Based on Alternation Principle:
According to Elliott Wave alternation guidelines, if wave (2) is deep and sharp, then wave (4) is expected to differ in:
- Depth: It should be shallow in comparison.
- Speed: Likely to be slower and more drawn-out.
- Structure: Instead of a simple zigzag, it may form a complex correction (e.g., double three or triangle).
- Texture: Price action may appear choppy or sideways.
Based on wave alternation, traders should prepare for wave (4) to be shallow, slow, and complex, in contrast to the aggressive nature of wave (2).
Moving Averages & Price Cluster Around Key Zone
The 100-day and 200-day moving averages are getting closer to each other, and the price is also moving toward them. This suggests a key zone where multiple technical factors are coming together. Interestingly, the retracement levels of wave 4 are forming a cluster right around the current price range. Since the price is still trading above both moving averages, the overall trend remains positive. This area could act as a strong support and might trigger the next leg higher if buyers step in.
We will update further information soon.
Get free important share market ideas on stocks & nifty tips chart setups, analysis for the upcoming session, and more by joining the below link: Stock Tips
Have you any questions/feedback about this article? Please leave your queries in the comment box for answers.
Wave (2) vs wave (4) breakdown was superb.
Perfect entry zones identified. Your price targets are always realistic and backed by solid structure.
Outstanding chart reading. Excited to see how the next wave unfolds!
Strong research. It’s rare to see such clarity in Elliott Wave analysis these days