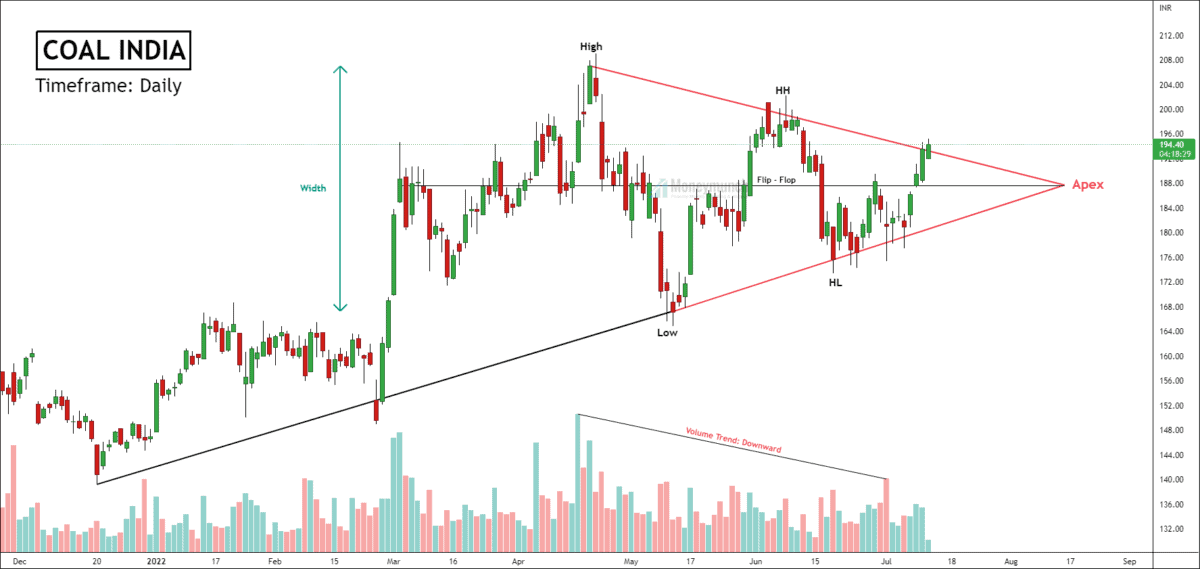
Coal India has formed a coil (symmetrical triangle) for three months. The trend of volume is downward. Coal India’s prior trend was bullish. This formation occurs when the market is indecisive.
Price makes higher lows and lower highs. It is the situation where supply and demand are near to equal. Within the triangle, the trading range shrinks. There is a pause in the exhausting trend, after which the original trend resumes.
If the price breaks the upper band of the triangle, traders can trade for the following targets: 198.45 – 210 – 218. A symmetrical triangle has a high success ratio of 84% in case of a break out of the upper band.
To become a subscriber, subscribe to our free newsletter services. Our service is free for all.
 Unlock This Article
Get free important share market ideas on stocks & nifty tips chart setups, analysis for the upcoming session, and more by joining the below link: Stock Tips
Have you any questions/feedback about this article? Please leave your queries in the comment box for answers.
I always make a profit when I trade chart patterns. I have been trading for 4 years and I can say that this chart is marvelous! keep sharing your work. Good luck!
As Always.. great analysis👍
Thank For The Hard Work. Cheers!!
Nice insight.
Pls share Reliance’s chart. Thank u.