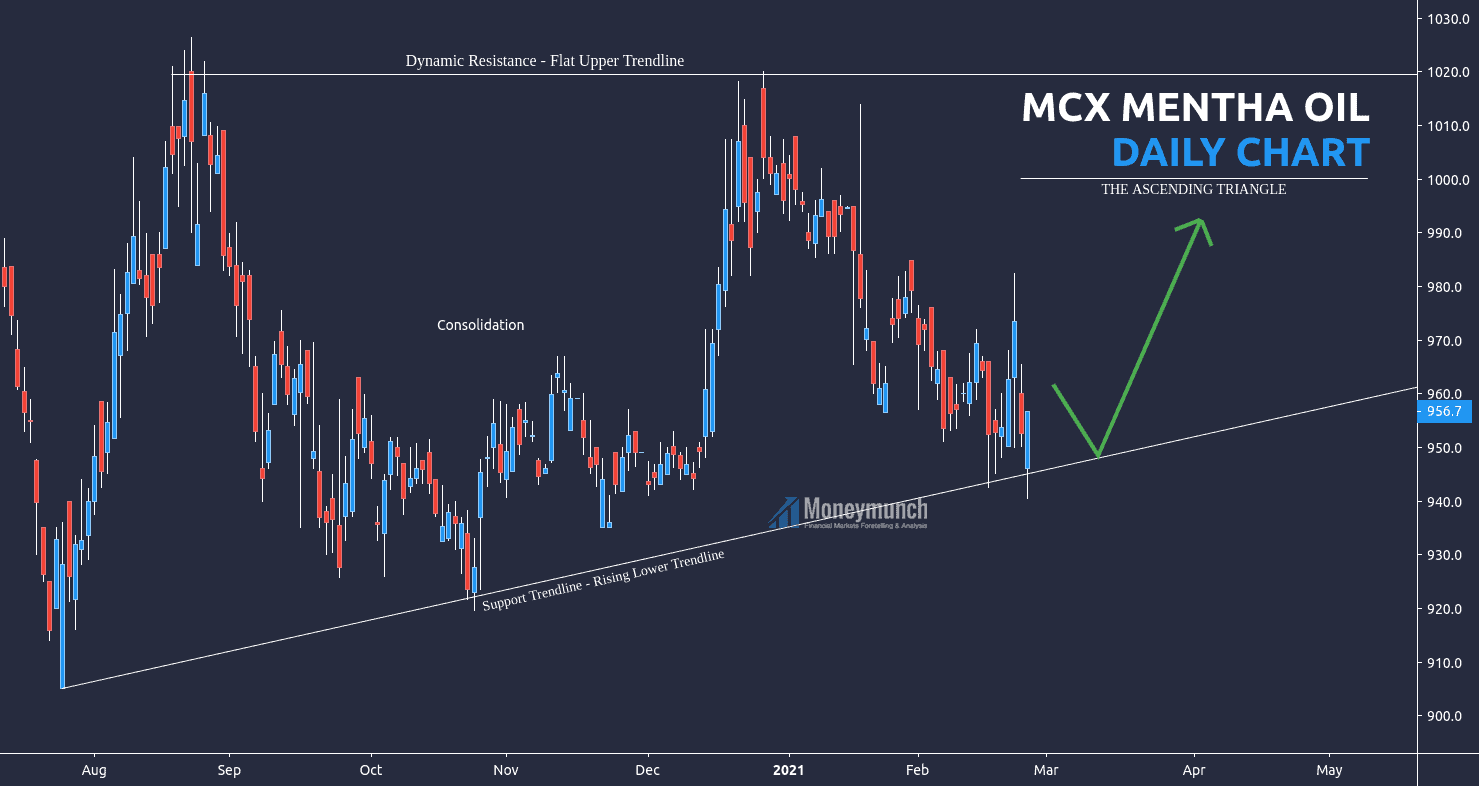
MCX Gold vs. Crude oil – Tips & Update

gold daily chart tips

Crude Oil Price Is Getting Ready For Its Next Breakout

free crudeoil tips chart

As per the chart and situation, we will see more downside jump in crude oil prices.
Downtrend targets: 800 – 760 – 700 – 600 – 560 below

Traders can stop selling if it closed above the 1600 level or watch out the resistance trendline.

In the next report, we will update on MCX Gold & Silver in-depth.

Guar Gum Sets Up For Another Massive Move Lower

NCDEX Guar Gum Futures is close to March low. It will keep falling if that level breaks.
Targets: 4660 – 4500 – 4400

Note: position can be initiated after a breakout of March low.

Don’t miss out to read the previous agri-commodity trading alerts report: Free Jeera & Cotton Tips

To become a subscriber, subscribe to our free newsletter services. Our service is free for all.

Continue reading

What’s Next for NCDEX Jeera & Cotton Price Trend Forecast

commodity jeera tips chart

Price Range: 5152
Breakout Range: 15600 – 10448
A short reversal started from the 13110 levels.

Short-term Trend Analysis:

MCX Cotton is a sellable script until it remains below 17000 for the target of 15800 – 15000.
Isn’t it enough to know the next move? To become a subscriber, subscribe to our free newsletter services. Our service is free for all.

Continue reading

Gold, Silver, Crude oil, Jeera, & Guargum Tips & Updates

Gold and silver are moving as directed in a weekly report. Hence, if you want to know what will happen next, read that reports now.

Read here: Gold & Silver Positional Tips & Reports

free crude oil tips chart

What’s next in crude oil? This week we are going to  intraday trading alerts on gold, silver, and crude oil. Hence, keep subscribed! To become a subscriber, subscribe to our free newsletter services. Our service is free for all.

Technical Perspective of Jeera

jeera tipsNCDEX Jeera may jump up to 14200 levels …but that doesn’t mean it will start moving upward until we see consecutive closing prices above it.

Bearish pressure will keep coming up to 13600 – 13260 levels.

Remember, don’t mess after crossover of 14200 levels.

Where’s the bottom of Guar Gum Futures?

Guar Gum’s strong support is at 6760. It has already broken in the previous trading sessions. You can start selling it after 6560 breakouts. This level will fall the prices up to 6400 – 6260.

But keep in mind, stay away after 6760 levels. Why? I will let you know in the next NCDEX Agri commodities report.

To become a subscriber, subscribe to our free newsletter services. Our service is free for all.

Continue reading

Gold & Silver Technical Charts, Deep Research, & Tips

free gold chart tips

MCX Gold Looking Upside But Is It?

If gold breakdown a flat resistance line, it will fly in the sky. Gold will pressurize by speculators up to 41400 – 41600 – 42000 levels.

Remember, it could happen by a complete breakout of a flat resistance line only.

Hurdle or ascending support trendline breakout indicates to stop buying. It will fall the prices up to 39560 – 39260 level.

free gold intraday tips chart

For trend identification, check this 15 minutes intraday chart of gold. Keep eyes on a lower trendline before initiating a position. Further information will update soon for the  subscribers only. To become a subscriber, subscribe to our free newsletter services. Our service is free for all.

Here’s the One Silver Chart to Watch

free silver daily chart tips

Gold can influence the silver price upside up to the upper trendline. As per the technical analysis, currently, it’s under downtrend. As described in the above chart, It may keep falling for 45600 – 45000 levels.

free silver intraday calls chart

Look at the many times tested level, this can drag the silver price up to 46400 – 46600+.

Continue reading

Free Tips on MCX Gold, Silver, & Crude oil with Daily Charts

Will Gold Prices Continue To Climb Higher?

MCX Gold prices blasted higher this year’s beginning, breaking out of their correction downtrend. What will happen next? Here’s how gold will perform this week:

free gold tips chart

This Time is Different for MCX Silver – 2020 vs. Dec 2019

First, I recommend to look out my 8th Dec 2019 Silver’s chart (Read Full Article).

free silver calls chart

Now, look at the current month chart:

As I had drawn, silver has performed. What else you want!?

Anyway, look into the chart, I have been drawing a new trendline. That is a trend confirmation sign. Don’t buy the silver below the 46600 levels. It could fall up to 46000 – 45360 from there.

And above 47000 levels, 47500 – 48000+ levels are waiting.

To become a subscriber, subscribe to our free newsletter services. Our service is free for all.

If history repeats, crude oil will head to 4500

free crude oil tips chart

We cannot say this the crude oil under downtrend. It needs a consecutive breakout below the hurdle line to confirm it. And that breakout will fall the prices up to 4020 – 3900 below.

Otherwise, it will start climbing for 4280 – 4360 – 4400+ levels.

Continue reading

Gold & Silver: Potential Breakout & New Targets

Gold at 33000 Will Start Real Fireworks on the Upside

free gold tipsWe have seen gold’s price at 33000 on last March beginning. Now its price is close to that level.

Shall we see that price again? Yes after a reversal.
Intraday traders know what to do now.

And crossover of the 33000 consecutively two days indicate the solid uptrend up to 33300 – 33600+ levels.

Caution: silver can run up to 37500. Intraday traders can stick up to this level. Afterward, wait for the next article or join to know more.

ncdex coriander tips

NCDEX Coriander Tips: Uncontrollable Bearishness

Coriander is just falling from the last May 31. It may come down nonstop up to 6800 – 6700 – 6600.
The closing price at or above 7080 can stop the downfall. To become a subscriber, subscribe to our free newsletter services. Our service is free for all.


Continue reading