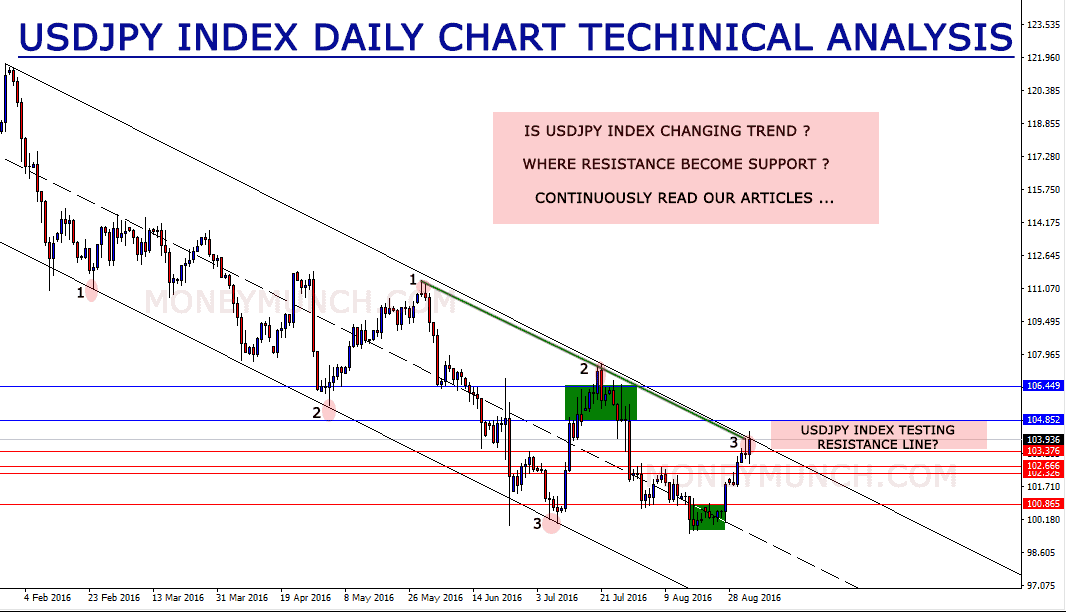
USDJPY index daily chart is indicating downtrend. You will see 103.376 – 102.666 ffffff– 102.326 levels soon.
104.599 level is resistance level for free subscribers.
Is USDJPY INDEX changing trend?
Where resistance become support ?
Get free forex & currency ideas, chart setups, and analysis for the upcoming session: Forex Signals →
Want to get premium trading alerts on GBPUSD, EURUSD, USDINR, XAUUSD, etc., and unlimited access to Moneymunch? Join today and start potentially multiplying your net worth: Premium Forex Signals
Premium features: daily updates, full access to the Moneymunch #1 Rank List, Research Reports, Premium screens, and much more. You΄ll quickly identify which commodities to buy, which to sell, and target today΄s hottest industries.
Have you any questions/feedback about this article? Please leave your queries in the comment box for answers.


 Lock
Lock
“Well since the day i have been checking and copying your signals i found it 90% profitable , because of the time difference I follow your signals only 4 hours a day buts its more than enough :) Thank you moneymunch market leaders , you really proved yourself the market leaders”
“Great work guys and I can confirm that I rode at least 300 of those pips of profits which your trading signals spotted over the last 7 days. It was great for my account. I just need to know how on earth you guys manage it?”