Mr.Dev(s) is a team of non-biased certified technical and research analysts with extensive experience in the financial markets dating back to 1997. They accurately forecast market movements and position their clients accordingly. They are popular online contributors on many channels and platforms, known for their non-biased advice and commitment to helping investors make informed decisions. The team is also the founder of forex account management services on Moneymunch.com, demonstrating their knowledge and experience in the financial world. Investors can rely on Mr.Dev(s) for research reports and opinions, as well as trading guidance.
Who want to make this week beautiful? Small traders just see MCX Zinc. Today zinc may crash. Buy in deep as you can because I’m looking ultimate targets: 110-110.8-111.3-112+
Just see mentha oil. Targets: 1343-1347-1350
To become a subscriber, subscribe to our free newsletter services. Our service is free for all.
Yesterday what I said about Cardamom? First click here and read it again I had written, “If once cardamom closes and cross 917 level above then my ultimate targets: 935-947-959-969” Yesterday my first targets touched…what else you need huh? It’s still moving upside and in coming days it’ll hit all targets but more information about Cardamom will be updated shortly.
Let’s talk about Mentha oil. Yesterday I also said about Mentha oil. Click here to read it. I said,”Just keep in mind below menthe oil targets. Intraday: 1279-1291 and Short term: 1300-1311″ IN ONE TRADING SESSION, MENTHA OIL KISSED MY ALL TARGETS! I hope everyone enjoyed!
NCDEX CASTOR SEED
Castor seed, one of my favorite agri commodity. Yesterday(click here to see it what i had written) I said, “Risky: you can see if it’ll open downside. Targets: 3543-3530-3517” Yesterday it kissed our first target. I hope everyone enjoyed! You know, it made ride very crazy that’s why I had written Risky. What I am saying, I hope lion heart traders for understandable…
Note: Yesterday I said about soybean also. I say, “If soybean open downward then Sell it.” But soybean opened upward. Yes, it kissed all targets but opened upside that’s why no one traded.
To become a subscriber, subscribe to our free newsletter services. Our service is free for all.
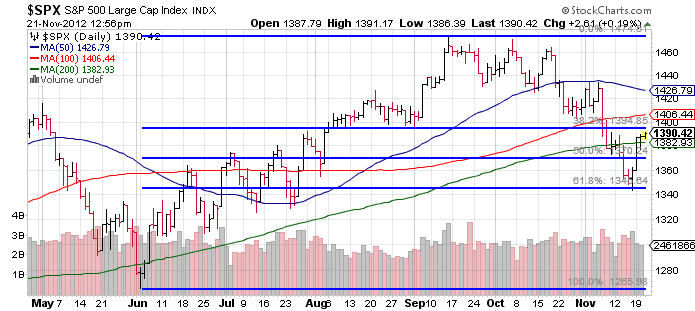
While things are never easy, the (quote-unquote) obvious trade in the major indexes has now played out, especially on the S&P 500. Of course most of it happened in an overnight gap up, but that has been par for the course. From here things get more complicated. Here are a few ways to look at the roadmap utilizing the S&P 500.
First the original S&P 500 chart that has been in play for months, looking at the June-Sep run, and pullback since. Two key points here – the index has bounced from the 61.8% retrace to nearly the original 38.2% retrace at ~1395. That number is also key in that it was support multiple times in August 2012. Support turns into resistance and vice versa so this 1395 level is a very obvious level to watch.
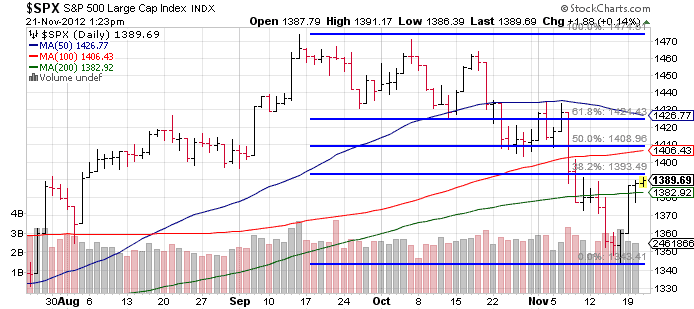
Second, is the chart I posted yesterday morning which is simply the same Fibonacci levels but focused solely on the September-November pullback. What’s the first number that sticks out? 1394 (call it 1395, close enough for government work). That is the 38.2% retrace of the two month correction.
If 1395 is vanquished, the next two levels are 1409 to 1424 which you can see was an area with a lot of traffic in late October to early November before the correction became much more ferocious. That second number also coincides with a falling 50 day moving average.
Last, on a very short term frame there is a potential for an inverse head and shoulders formation (which favors bulls) in the near term. The head being Thursday/Friday’s lows and the neckline being about “here” at 1390. If that does play out, it measures to a target of ~1430. That would be a 3% move from here.. and still not create a new higher high versus those early November levels. Hence all that could in theory happen and still bode poorly afterwards. But either way, one can see all the congestion and push pull in the areas overhead.
Of course all this coincides with positive seasonality, the constant negotiations re: the fiscal cliff, the next round of easing to be announced at December’s FOMC meeting (to replace Operation Twist), and a slowing corporate earnings outlook.
Anyhow enjoy the Thanksgiving holiday and we’ll catch you on the other side.
We’ve been surprised at the recent action in the precious metals complex. During the recent correction the shares were showing quite a bit more strength than the metals. Then the shares took a dive below support yet the metals maintained their recent lows! How do we interpret this wild volatility in the relationship between the shares and the metals? Quite often we look at daily and weekly charts. Now is the time to take a look at the monthly charts which can help us get a better read on the larger trends at hand.
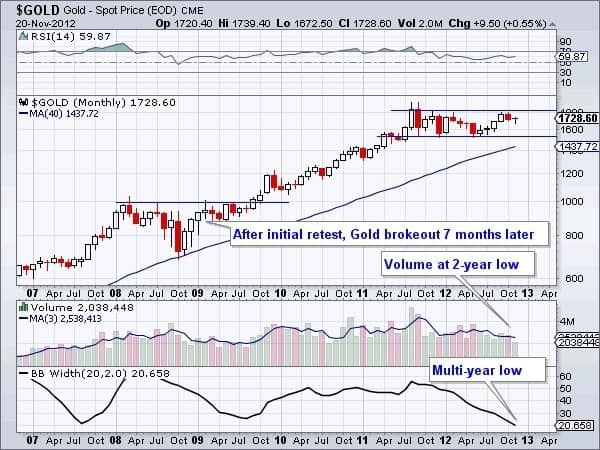
The monthly chart of Gold shows the yellow metal in a very healthy consolidation between $1550 and $1800. Gold’s current retreat from $1800 has lasted two months. Back in 2009, Gold brokeout to a new all-time high in the seventh month of its consolidation. Presently, Gold’s bollinger band width is at a multi-year low and its three-month volume average is at a two year low. Also, the RSI has bottomed and made a higher low. Even if Gold touched $1600, it would remain in healthy position for a breakout in 2013.
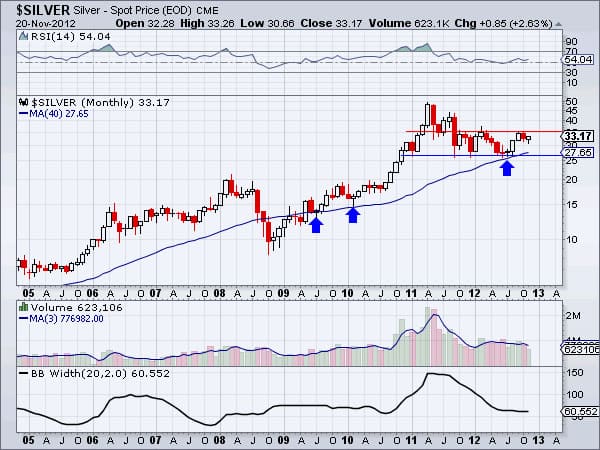
Gold’s companion Silver is currently trading in a tighter consolidation with $35 as resistance and $27 as support. Note that Silver has tested and held above $27 six times in the last fifteen months. Silver also held above the rising 40-month moving average which supported the market in 2009 and 2010. The RSI has also made a higher low and volume has trended down during the past seven months.
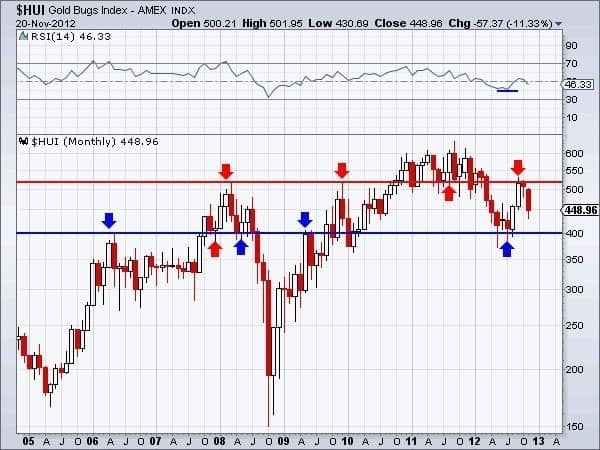
Meanwhile, the gold stocks (HUI) look weaker than the metals. Momentum hasn’t confirmed its bottom as the market is in a clear range from 400 (support) and 525 (resistance). Note the current 11% decline in the HUI for the month while Gold and Silver are still in positive territory. Nevertheless, if and when the HUI prints a monthly close above 525, this chart would like quite bullish and general sentiment would certainly pick up.
The evidence argues that the bottoms remain well intact and the metals are consolidating before the next breakout which entails Gold breaking $1800 and Silver $35. However, these breakouts are by no means imminent. Since we are dealing with monthly charts that means potentially three or four more months of consolidation. Furthermore, sentiment data such as the COT structure and public opinion polls need some improvement before the market could sustain a breakout. Thus, more consolidation could be the order of the day for the metals.
Continued consolidation in the metals also helps explain recent weakness in the HUI, which is simply testing the lower half of its own consolidation. The shares see the weakness in the overall market and perhaps sense that an immediate breakout in the metals is unlikely Furthermore, while central banks have put themselves in position to act they haven’t actually done anything yet. When the market senses their action it will likely mark a final low within this consolidation.
The good news is the metals remain in fine shape and so to do most of the mining equities we follow. If we are indeed correct that the metals and shares will remain range bound then your task is simple. Prepare yourself for further consolidation by having your buy list ready and then be ready to act when the time comes. A wise friend once told me that in a bull market the goal is to accumulate positions at the lowest prices possible. With mining equities trading well off their highs, now is the time to do your research and find the companies that will lead the next leg higher and outperform the gold stock sector.




 Unlock This Article