Continue reading
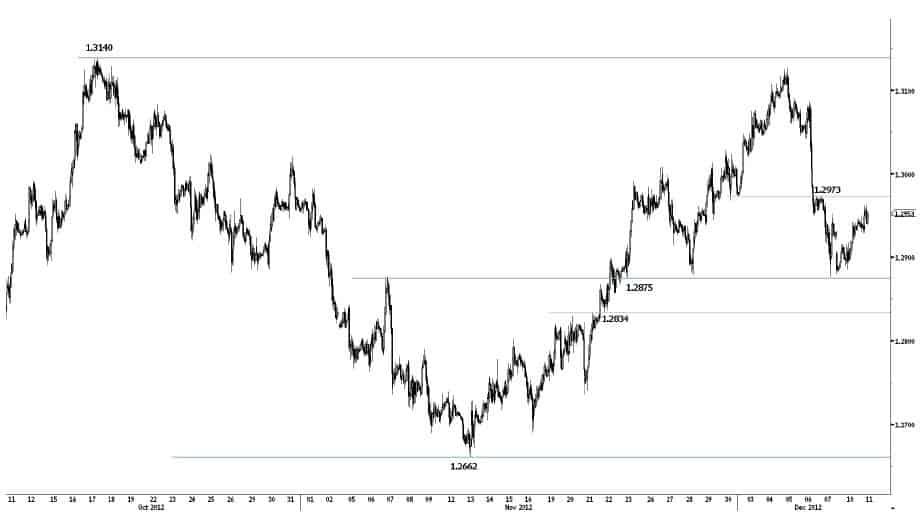
EUR/USD(Bouncing on support at 1.2875) updated 11-12-2012
Await fresh signal.
Bouncing on support at 1.2875.
• EUR/USD has successfully tested the key
support at 1.2875. Resistances for a bounce are
given by 1.2973 (07/12/2012 high) and 1.3046
(04/12/2012 low).
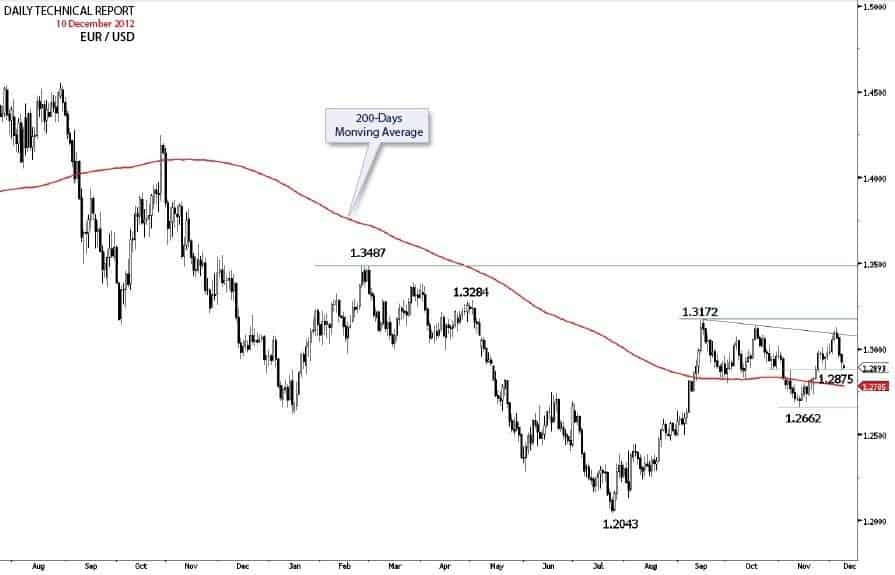
• The underlying trend is negative (see the
succession of lower highs since May 2011 peak).
Therefore we expect limited upside potential
given the strong resistance at 1.3172 (17/09/2012
high) and the overall overbought conditions.
Continue reading
EURUSD (Await fresh signal)
Testing support at 1.2875.
• EUR/USD has weakened after failing to break
the resistance at 1.3140 (17/10/2012 high).
Monitor the test of the key support at 1.2875. An
hourly resistance is at 1.2973 (07/12/2012 high).
Another support can be found at 1.2834
(intraday low).
• The underlying trend is negative (see the
succession of lower highs since May 2011 peak).
Therefore we expect limited upside potential
given the strong resistance at 1.3172 (17/09/2012
high) and the overall overbought conditions.
Continue reading
Global Market: Short Term View
SPX Long Term
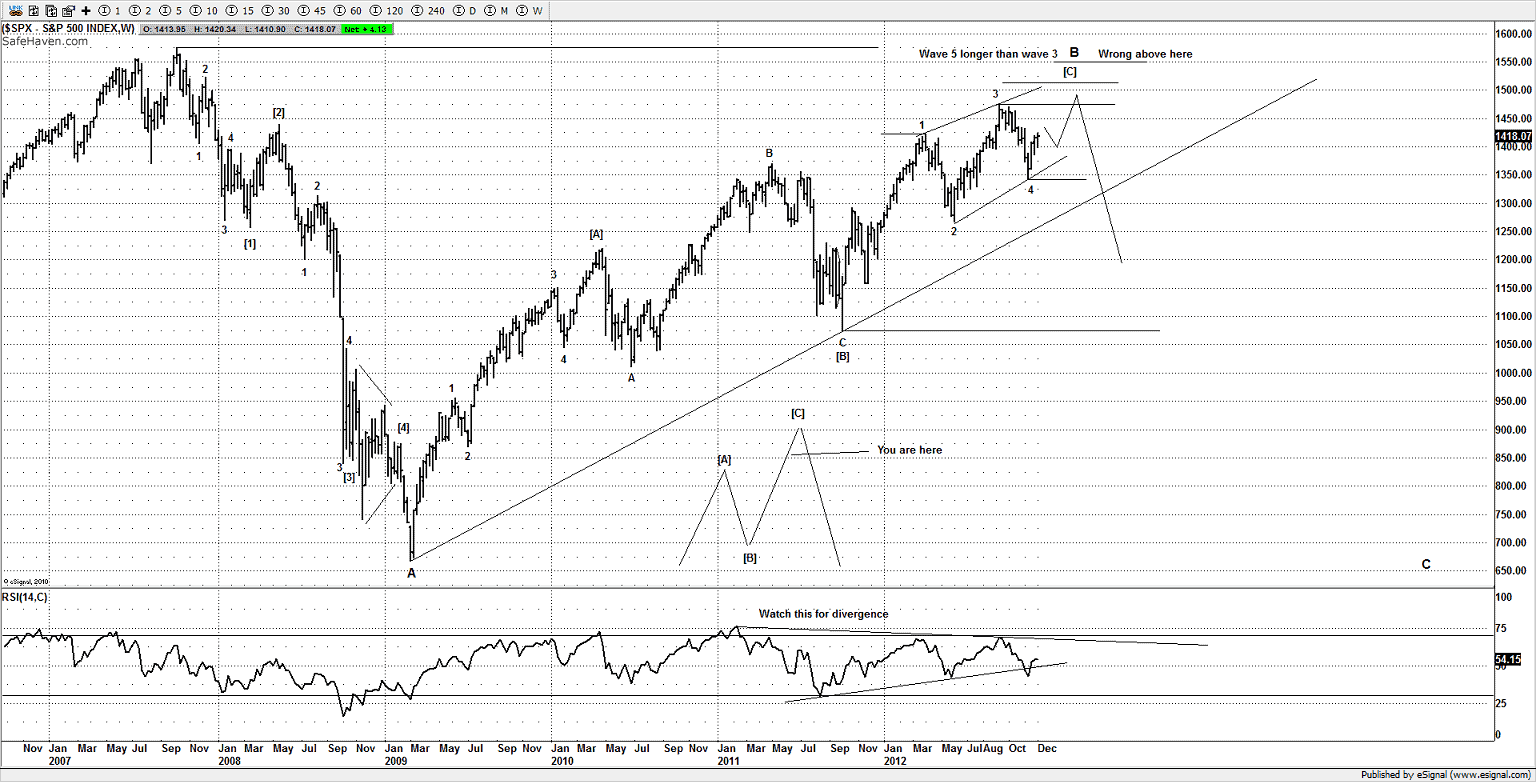
My preferred wave count is similar to the idea I posted some weeks back on the DAX and that I suspect the SPX is inside a 5th wave for an ending diagonal so likely to chop higher into Jan-Feb period next year before a meaningful high. It would need a seriously strong break below the 200DMA on the SPX before I would switch to an alternative bearish idea, whilst this market continues higher I still prefer the bullish option over the bearish option.
Although I am certainly no perma bull and calling for SPX 2000 or anything like that, recent price action over the last few days suggests the market is simply correcting the advance from the Nov 2012 lows and likely to push higher once the correction has finished.
When you look at other US markets we can clearly see the same sort of shape, especially markets such as the NYSE. The last decline from the September 2012 highs was a 3 wave decline as we can clearly see the NYSE is pushing higher as I suspect it would, but is lacking the new high it needs to complete its idea.
Continue readingS&P 500 Panic Coming!
The TV pundits all contribute their fair share to the conditioning process by clouding thoughts of any market player. To the extent that all ambiguities presented will bait investors to thinking IRRATIONALLY! Like, waiting for a 1000 point rally to emerge once the fiscal cliff is resolved.
Fortunately, underneath all the headlines a visual and graphical interpretation can be mathematically extracted. It is here, in these very charts, where you will find an answer that illustrates what is really going on, so that us technicians can observe, scrutinize, and formulate a particular bias.
The information provided does not tell you why, or when, but what!
In this case, ‘the what’ is a bear market rally. These particular rallies are very sneaky and most convincing, but can be properly identified when using the right tools.
For starters, a basket of heavily weighted companies, ‘THE NIFTY FIFTYs,’ which offer the bulk in the performance in the averages -all now have chart patterns that cannot sustain the continuation of this advance. Invariably, when volume remains light during an extended window of time, the result is an inevitable sharp collapse back downward to the previous lows or worse, new lows that can no longer support a bull market.
The S&P 500 index is a case in point, which is still in rally mode, and perhaps can continue higher if there is further consolidation. But if only mother market is ever so accommodative to our own expectations.
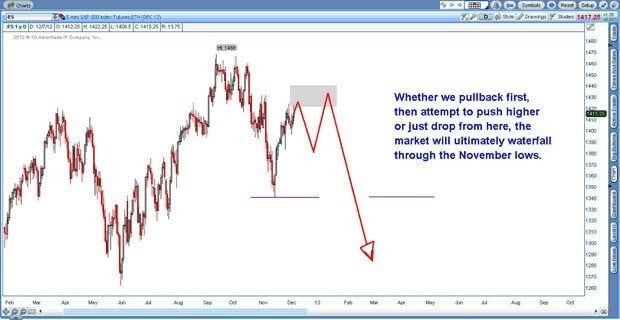
And it is because of her complexities that make it an impossible arena for perfection. The current rally back is clearly overworking itself to recapture the previous drop in November and rather than guessing where exactly it will end, think of it in terms of direction. The future course of these violent counter trends ultimately end in a scare plunge; and all the pumping in the world cannot uphold the violent cascade of selling pressure that will implode on the masses.
Consider the technical chart below, which projects a disaster waiting to happen, and with only a small chance of one last leg higher before this rally is all said and done.
S&P 500 – Daily Chart
To become a subscriber, subscribe to our free newsletter services. Our service is free for all.

Continue reading
UPDATE: Copper all targets kissed!
Yesterday what I had written about Copper?
Click here to read it again
I said, “Once it should be open upside and trade on it like hungry tiger with S/L 443. Targets: 446-446.8-447.2+“

As I said my all targets blasted yesterday, enjoy everyone!
For to know more about MCX Market, become a subscriber, subscribe to our free newsletter services. Our service is free for all.
Continue reading