Mr.Dev (s)

Mr.Dev(s) is a team of non-biased certified technical and research analysts with extensive experience in the financial markets dating back to 1997. They accurately forecast market movements and position their clients accordingly. They are popular online contributors on many channels and platforms, known for their non-biased advice and commitment to helping investors make informed decisions. The team is also the founder of forex account management services on Moneymunch.com, demonstrating their knowledge and experience in the financial world. Investors can rely on Mr.Dev(s) for research reports and opinions, as well as trading guidance.

Join Today (Free): Commodity Tips | Forex Signals

S&P 500, Dow Jones and EURO

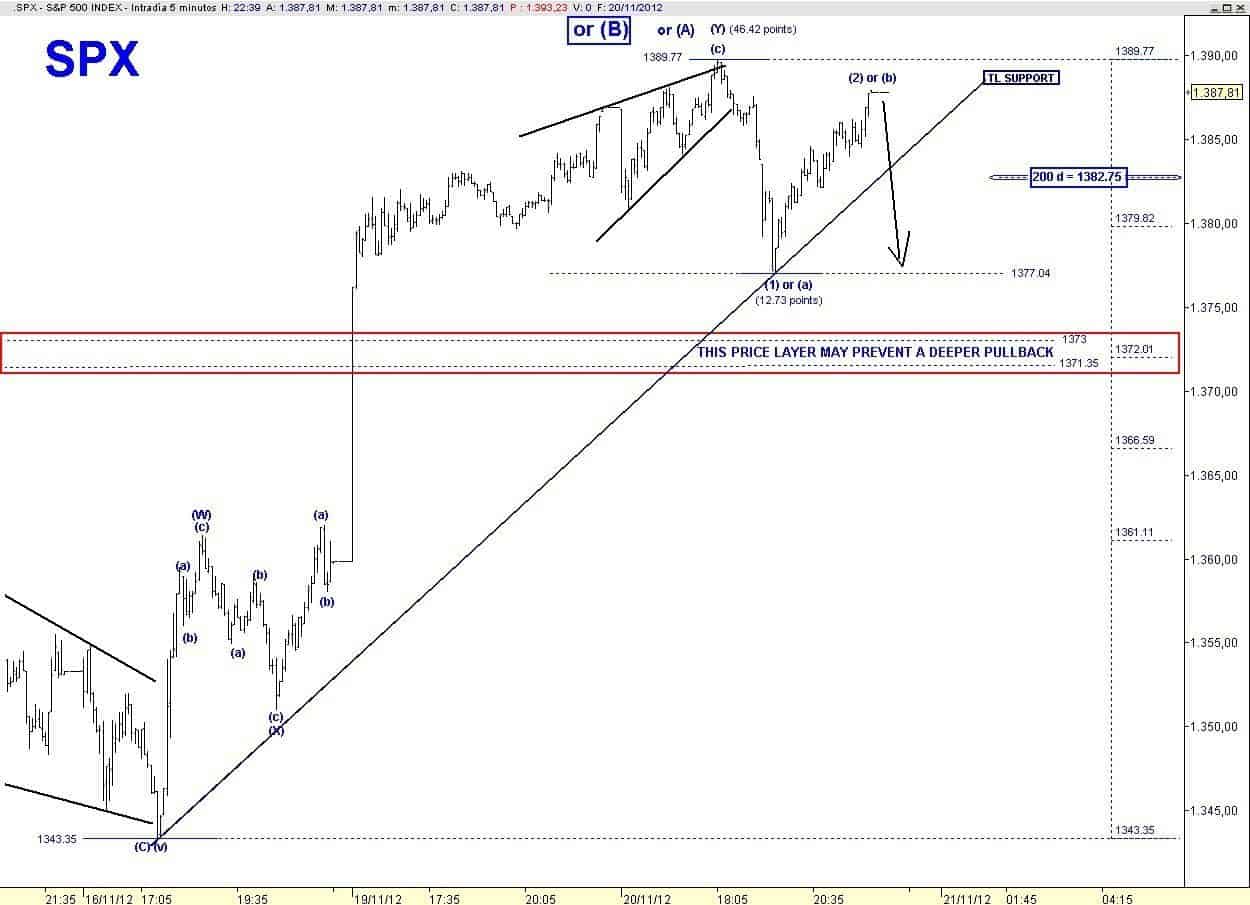
Yesterday SPX fulfilled the script of a narrow range body, it’s the common candlestick (in this case a bearish Hanging Man) that usually follows a white Marubozu. It means consolidation of the previous gains and hesitation.

This pattern could evolve into a bearish reversal pattern ” Evening Doji Star” if today we get a gap down and go. But this is not my preferred scenario.

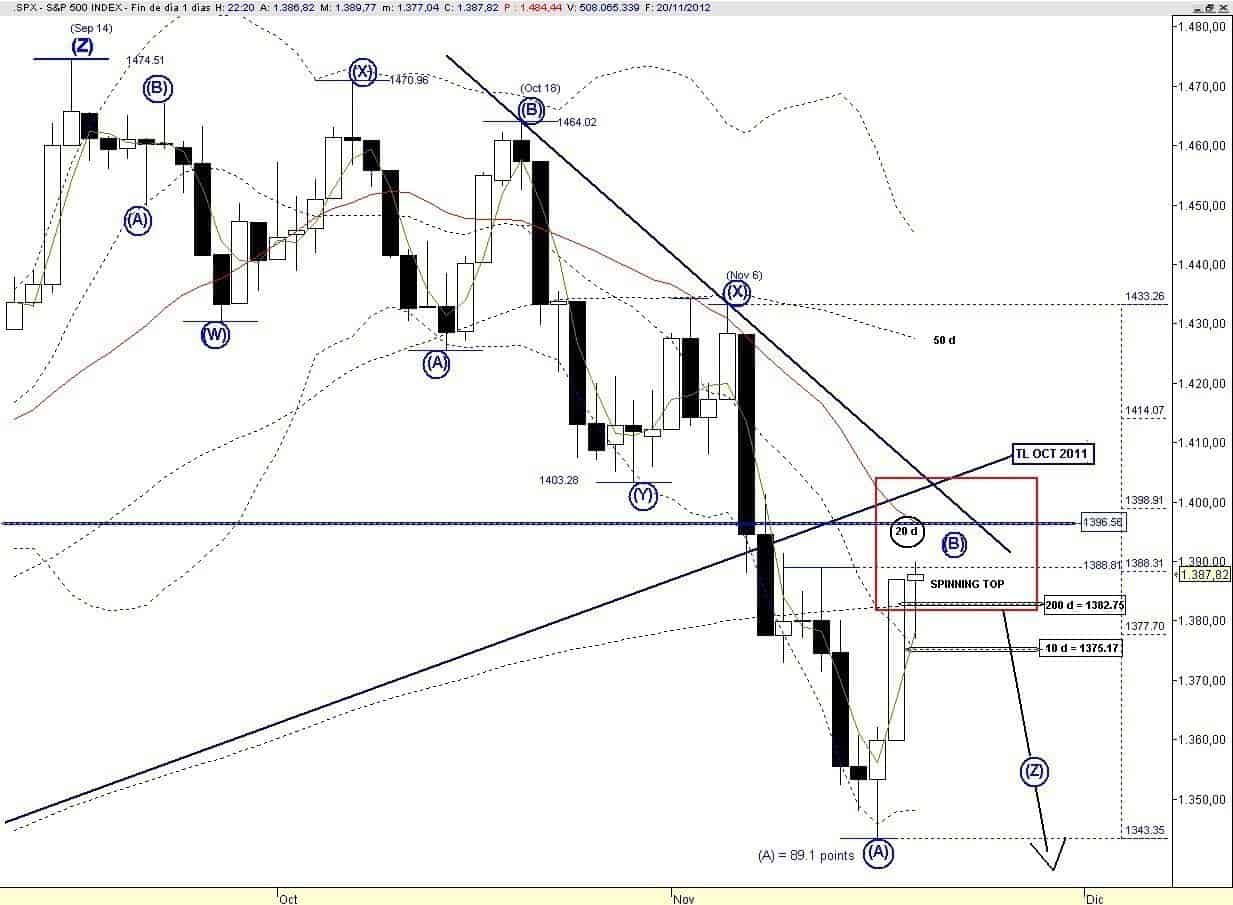
Regarding the overall count from the September 14 high, I don’t even change a comma, since I remain firmly confident that the current “countertrend” rebound will top in the target box that I have been highlighting in the last few days. Critical overhead resistance is now not far away, either 1397 or a kiss back at the previous trend line support off the October 2011 now converted into resistance.

Once/if price confirms my preferred scenario the last wave (C) down, which could match the length (89.1 points) of the previous down leg; wave (A), is expected to complete the EWP off the September 14 high, hopefully with positive divergences.

For the short term the 10 d mas = 1375.17 could be the demarcation between a mild pullback and something more bearish.
sp-500-price

Regarding the labelling of the current rebound so far we have a 3-wave up leg or a corrective variant (DZZ) therefore we have 3 options:

  • The “oversold” bounce is over ==> the wave (B) is done.
  • Price has established the wave (Y) of a larger Double ZZ.
  • Price has established the wave (A) of a larger Zig Zag.

So we need to see the internal structure of a pullback in order to increase the confidence on a count.

For the immediate time frame yesterday’s down leg after completing an Ending Diagonal suggests that there should be at least one more down leg.
sp index

As I mentioned yesterday I am watching:

1. EUR: “Since in my opinion the internal structure of the rebound off the November 13 lod is clearly suggesting that in the near future price has more business to the down side. So far bulls here are struggling to reclaim the 200 d ma, which coincides also with a strong horizontal resistance, while slightly above there is the steep declining 20 d ma. Barring “good news”, with the current weak structure, which could be shaping a bearish Flag, price should reverse in the range of the Trend line resistance in force since the October 17 high and the next horizontal resistance at 1.2876″.

So far price is maintaining the sequence of higher lows hence if price breaks above 1.2840 (trend line resistance off the October 17 high) then within the corrective pattern in progress price could extend the move towards the next resistance located at 1.2876.

euro

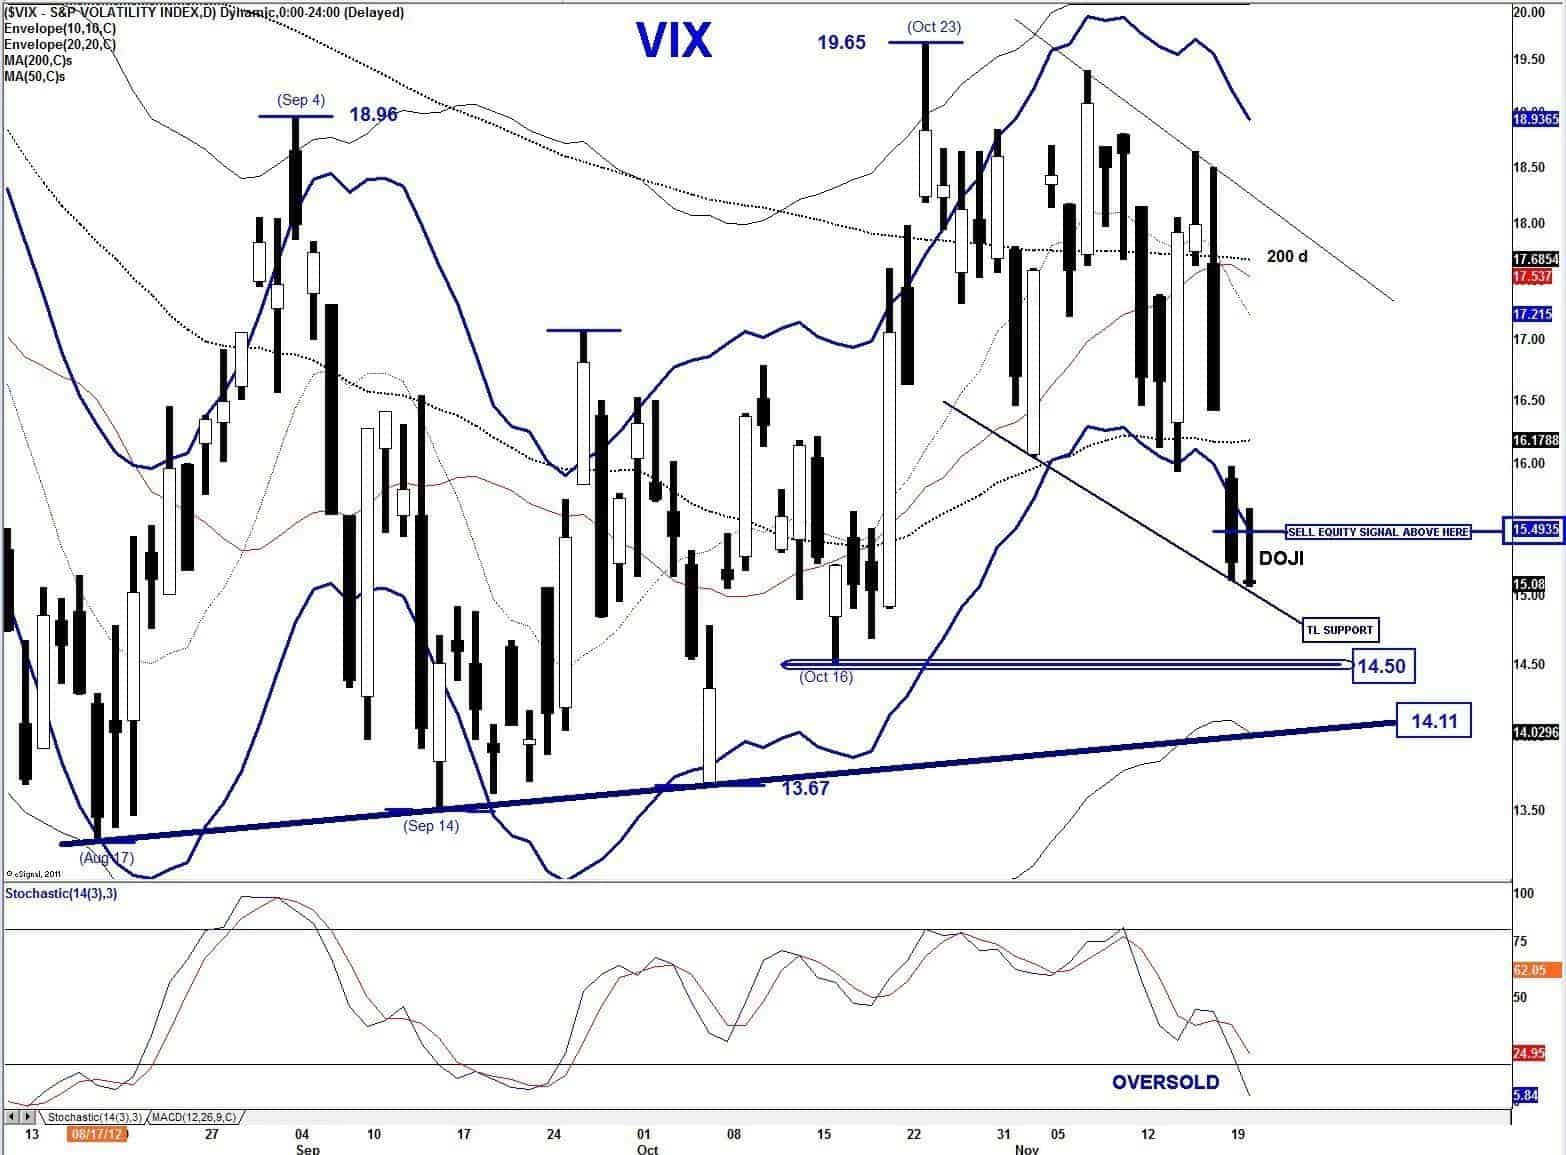
2. VIX: we now have to watch the trend line support and the possible “sell equity signal” that would be issued with en eod print above the Bollinger Band of the Envelope > 15.50.

Yesterday’s doji + oversold Stochastic are favouring at least a bounce attempt, although ahead of Thanksgiving holiday it may not be a reliable indicator.
sp-500-vix

I wish a wonderful Thanksgiving to US readers.
Continue reading

Gold and Silver Trading Tips Report

gold-spot-price3

Gold-and-Silver

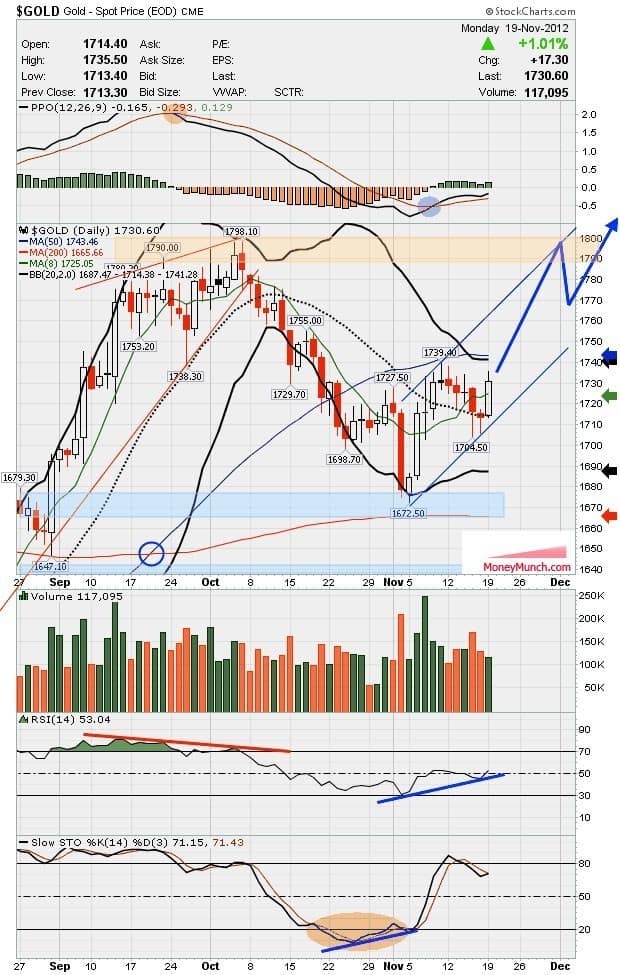
Arguments for lower prices:

  • 3rd attempt (within 11 months) to take out heavy resistance around US$1,790.00-1,800.00 failed and Gold clearly broke down from bearish wedge in October
  • COT Data again pretty bearish for gold and silver
  • Mining Stocks crashed down through support and 200-MA
  • US-Dollar in short term uptrend since mid of september, so far no clear trend reversal
  • Recession in Europe, slower demand from China and India

Arguments for higher prices:

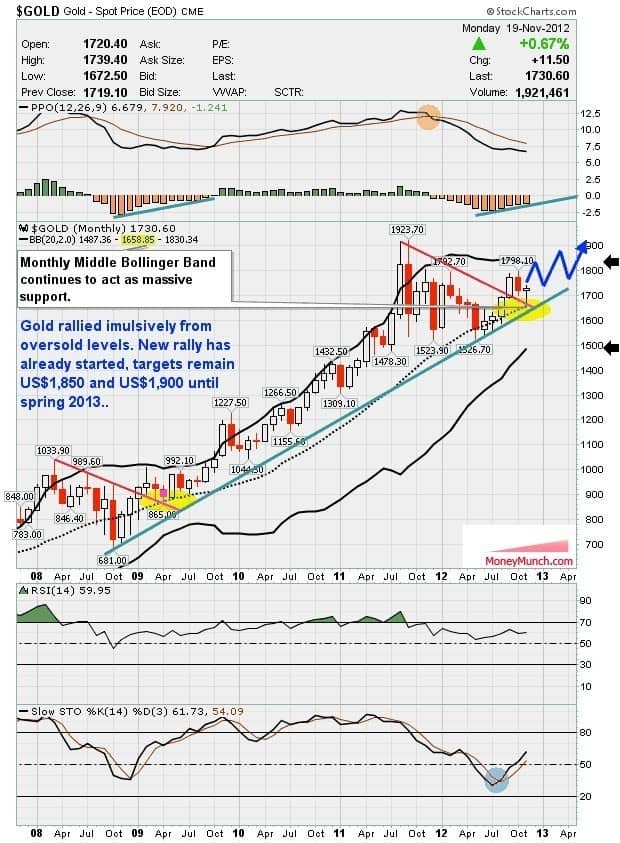
  • Gold & Silver bounced impulsively from oversold levels. This price action has a very bullish character.
  • Gold clearly above 200-MA (US$1,665.66)
  • Reversal at Fibonacci retracement, this confirms “correction” within uptrend
  • Gold/Silver ratio heading lower again, creates MACD buy signal for precious metals
  • Longer term Gold in similar correction pattern like 2008/2009. Breakout to US$2,000.00 expected to happen in summer 2013
  • New uptrend in precious metals since august 2012 that should carry gold up to US$1,850.00 and 1,900.00 until spring 2013.
  • US-Dollar Death Cross (long-term 200-MA broke above its short-term 50-MA in mid of october). This signals dollar weakness!
  • November very bullish seasonals. Seasonality until spring very promising.
  • Never fight the FED. Unlimited QE -> money printing all over the world will push asset prices in all sectors higher…
  • Throughout history, periods of massive money creation have always been inflationary and this time should be no different.
  • Santa Claus/Year End Rally has probably started yesterday
  • massive tension and escalation in middle east (Israel & Gaza, maybe Egypt and other states to get involved ?)

Conclusion:

  • After the initial impulsive bounce from oversold levels Gold has been consolidating between US$1,740.00 and US$1,705.00 in a bullish fashion. Now Gold looks ready to break out above US$1,740.00 very soon. This breakout will start a heavy wave of buying/short covering and should bring gold very fast to next resistance at US$1,790.00 / US$1,800.00. Here another setback must be expected. Overall I continue to believe that Gold will move up to US$1,850.00 and around 1,900.00US$ until spring 2013.
  • Any break below US$1,705.00 and especially US$1,696.00 would be very bearish but is not expected.

Long term:

  • Nothing has changed
  • Precious Metals bull market continues and is moving step by step closer to the final parabolic phase (could start in 2013 & last for 2-3 years or maybe later)
  • Price target DowJones/Gold Ratio ca. 1:1
  • Price target Gold/Silver Ratio ca. 10:1
Continue reading

Indian Gold Demand Picks Up

Indian Gold Demand Picks Up

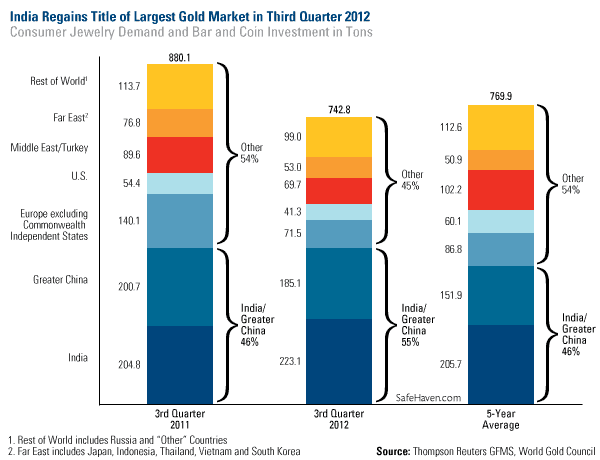
The love for gold has been reignited in India, according to the World Gold Council (WGC) in its Gold Demand Trends for the third quarter of 2012. India regained its title as the strongest performing market, overtaking the greater China area, as the country experienced a bounce-back in demand due to improved sentiment during the festival season. Compared to the third quarter of last year, Indian gold jewelry demand grew by 7 percent while gold bar and coin demand rose 12 percent. Total consumer demand was 223 tons, compared to 205 tons this time last year. The second largest market was Greater China, which consumed 185 tons in the third quarter of 2012. This was less than the 201 tons consumed in the third quarter of last year. Together these markets in the east made up 55 percent of the world’s jewelry and investment demand, according to the WGC. indian-gold Although India experienced a setback earlier this year when gold shops boycotted a proposed tax on the yellow metal, imports recovered by July “as inventory levels were bolstered (aided by a well-timed dip in the local price) and the market adjusted to the customs duty,” says the WGC. The third quarter has historically been a strong seasonal time for the Love Trade to come alive in the east. Monsoon rains and the festival season in the fall are generally associated with the buying and giving of gold. Still, for the year, don’t expect the Love Trade in India to be as strong as it was in 2011, as gold demand remains subdued with the ongoing weakness of the rupee.

Read More…

Continue reading

ETF (GOLD & US Dollar)

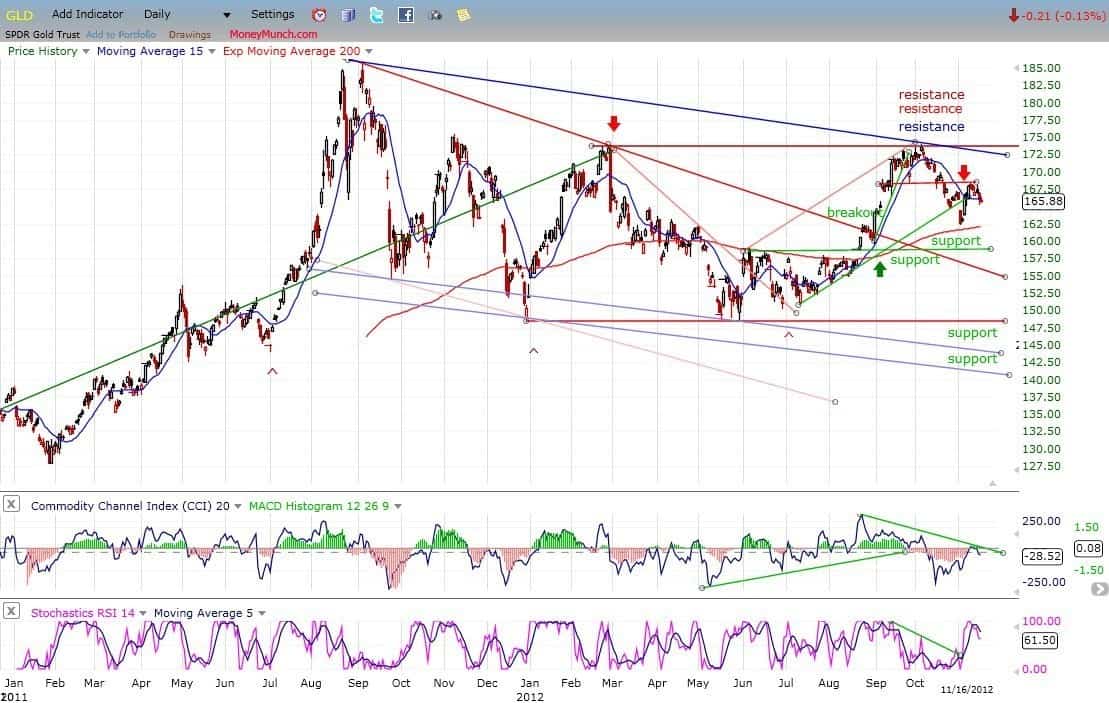
On its way down from 168, GLD broke its first support level and came to rest on the second (200-DMA) from which it had a bounce. Last week, I suggested that it might find some resistance on the small horizontal red trend line, which it has, and which caused it to pull back three points. It’s difficult to see how it could have much more of a decline right away if the market is going to have a mid-correction rally, so we can probably expect the near-term trend to turn up again, perhaps reaching the top channel line (blue) before rolling over again.

Gold Etf

If GLD does not have much of a rally from here – especially if the market does rally – it will be an indication that some decent weakness can be expected into the cycle low. In any case, subsequent action should form a P&F pattern which will help us determine the extent of the decline into the 25-wk cycle low.

UUP (dollar ETF)

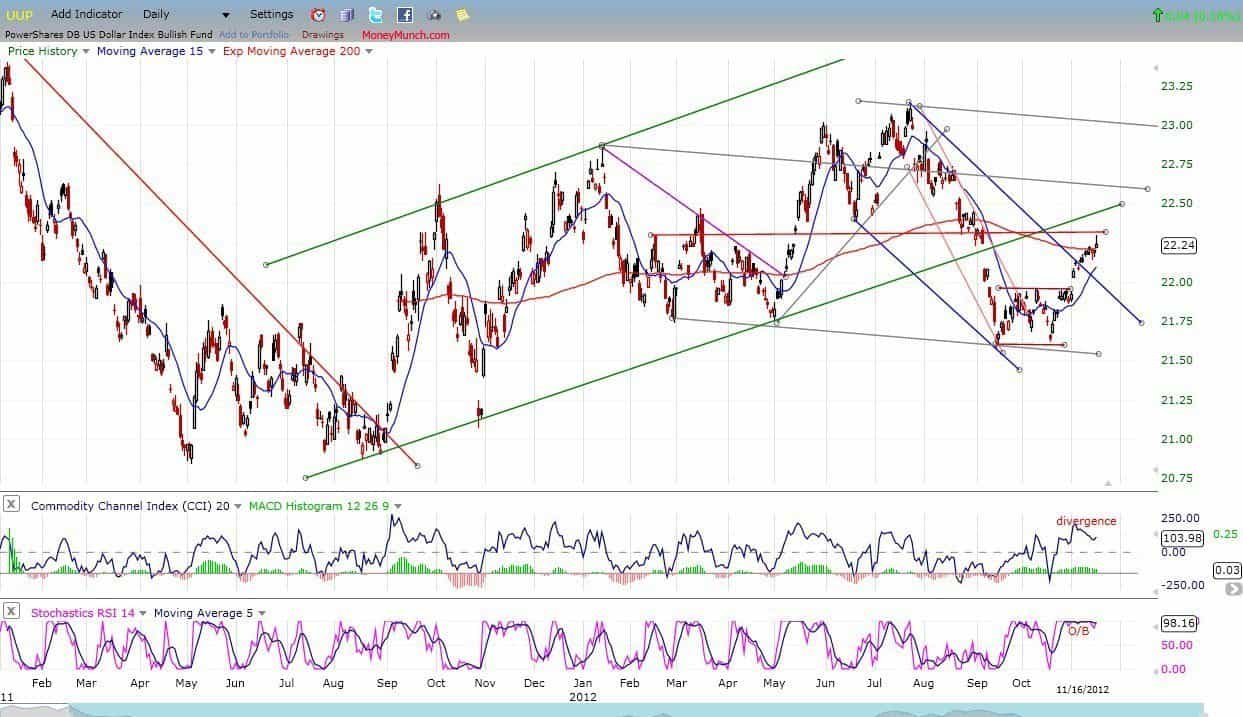
UUP normally goes against equities and gold. The index appears to be extended short-term and eady to pull-back. This can be seen in the indicators, one of which is very overbought and the other beginning to show some negative divergence. If a short-term top is forming, this should help the market to find a short-term low.

US Dollar ETC

Continue reading

UPDATE: Aluminum and Mentha oil – All targets touched + Cardamom report

mcx aluminium calls

What I had written about Aluminum on 16th Nov?
Click here to see it
I said, “Sell aluminum, Targets: 106.6-106.4”

gif-kungfu-panda

Aluminum was kissed our first target on that day and still moving downward. Yep, our subscribers booked profit on 1st first target!

mcx mentha oil tips

I had also written about Mentha oil on 16th Nov…Click here to see it.. I said, “You can buy menthe oil..Targets was: 1213-1219”

gif
Mentha oil touched our all targets enjoy!

To become a subscriber, subscribe to our free newsletter services. Our service is free for all.

Continue reading

S&P 500 Weekly Update

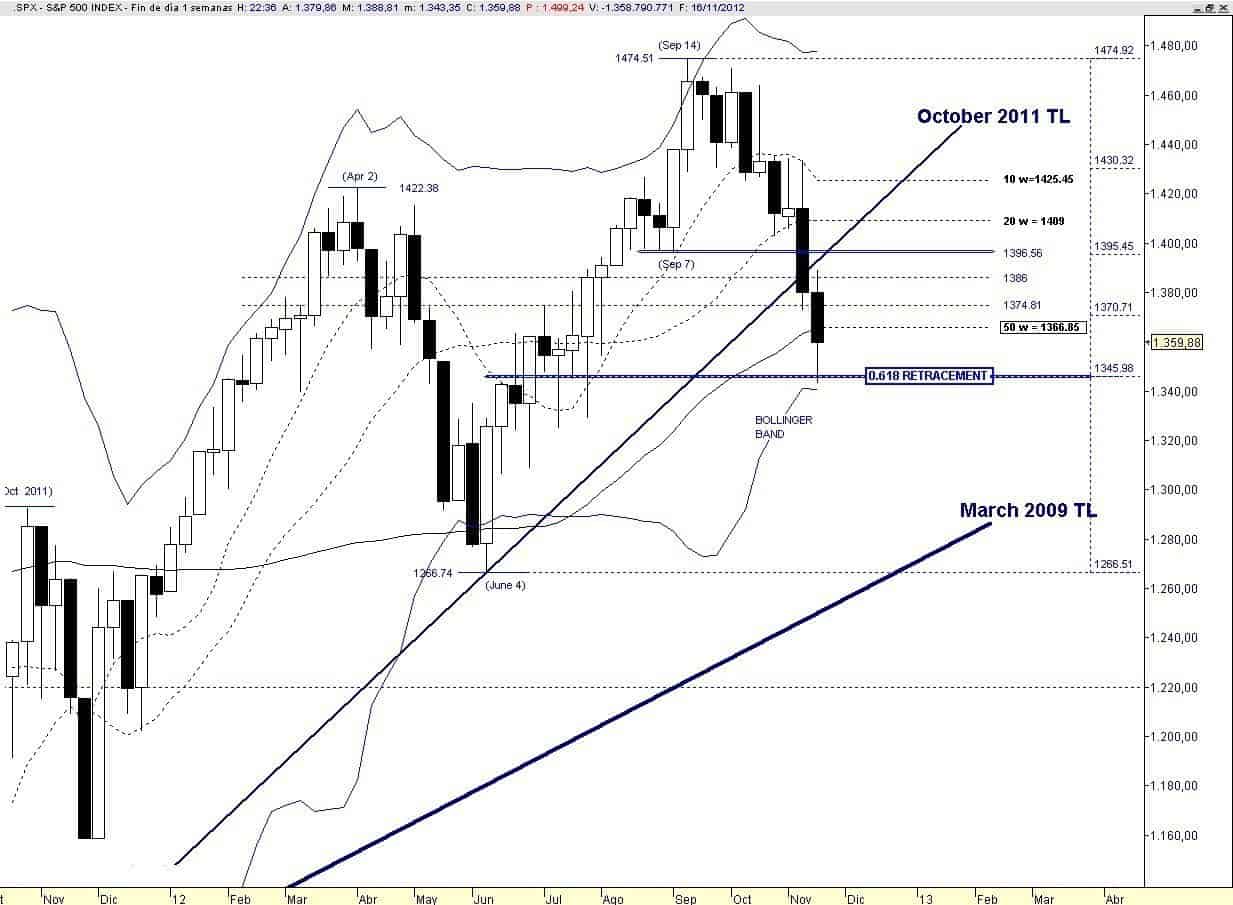
Last Friday I suggested that price was involved in unfolding a terminal pattern: “Maybe price is unfolding a Triangle that should establish a bottom with the last thrust down, who knows if at the 0.618 retracement the PPT will step in.”

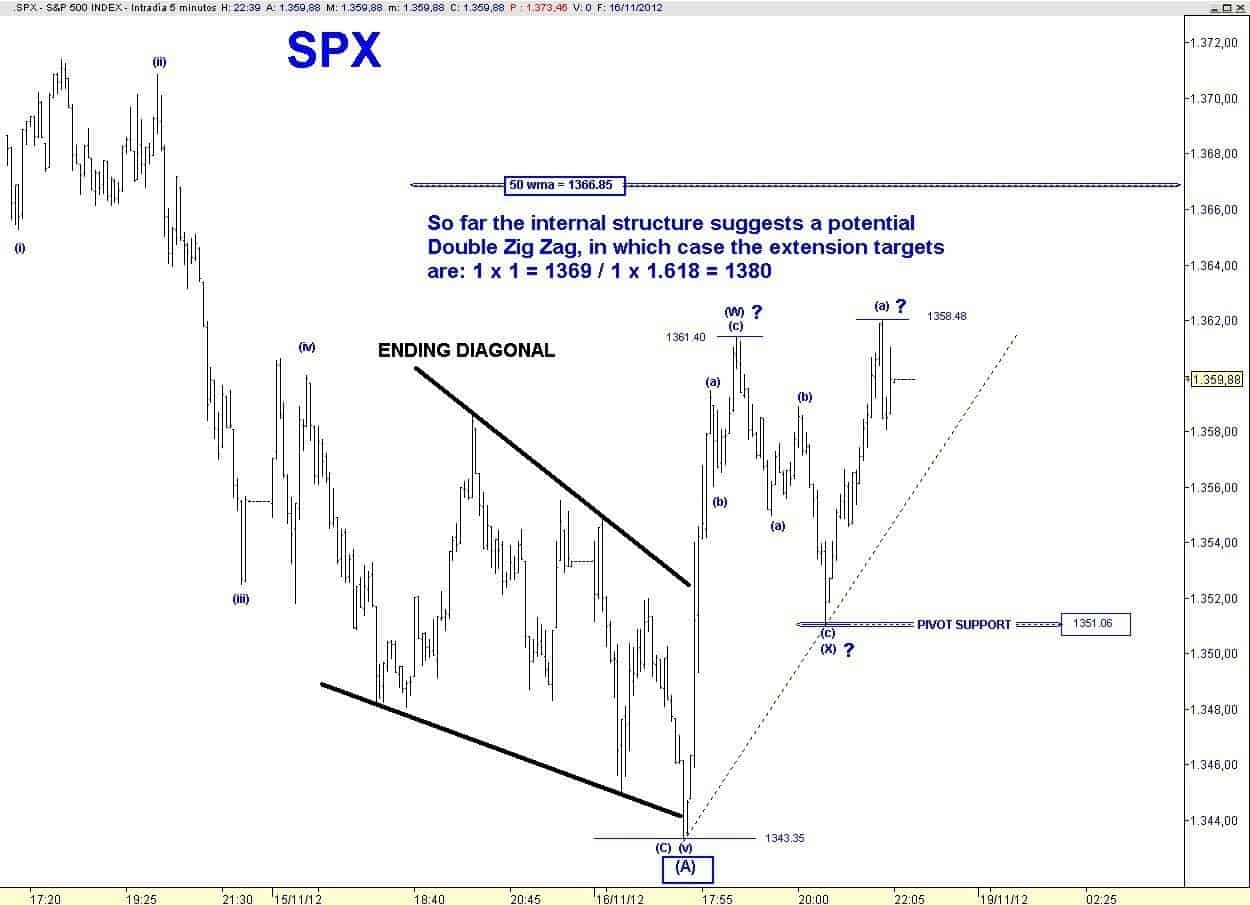
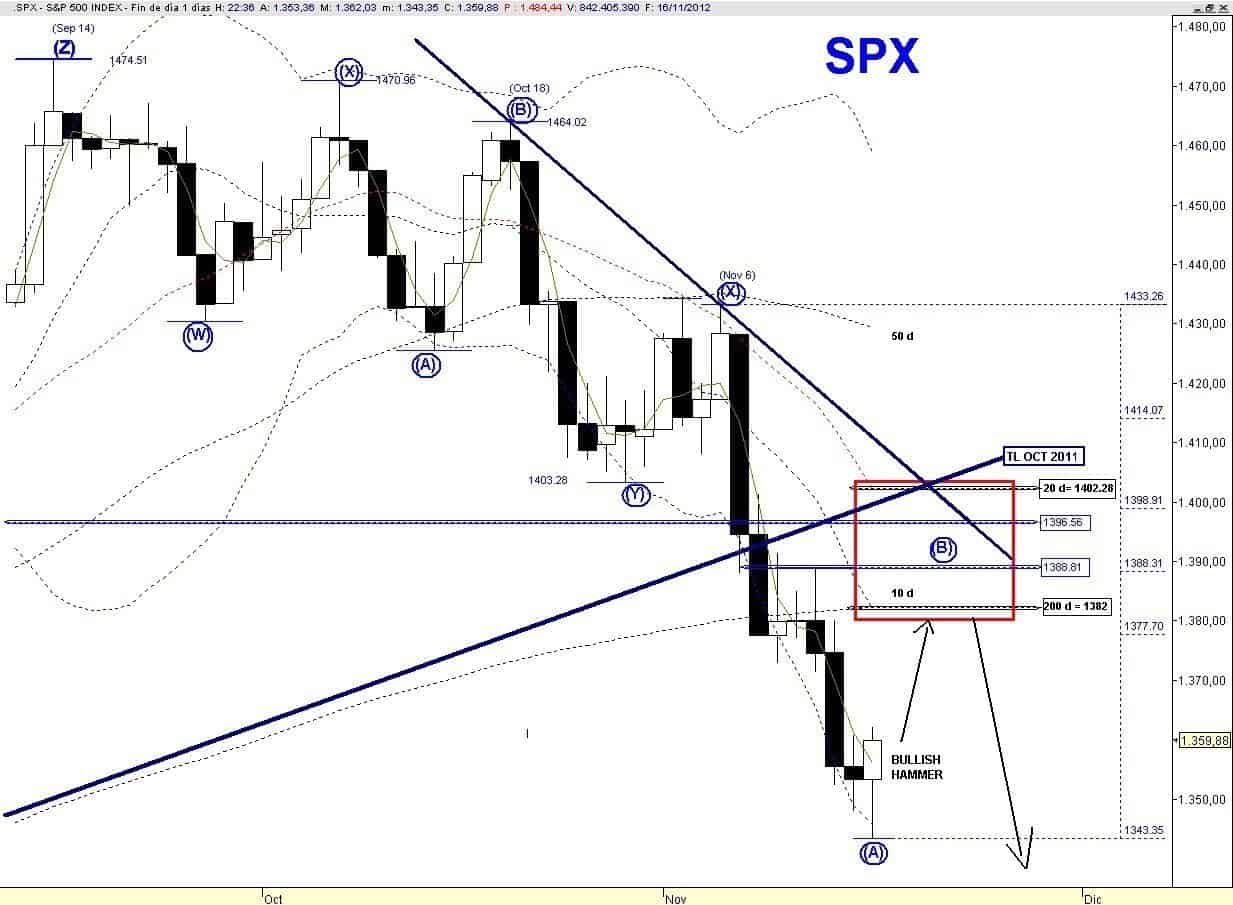
Instead of a Triangle price traced an Ending Diagonal, some good news came form Washington and price after testing the 0.618 retracement reversed to the upside, leaving in the daily chart a bullish hammer.

Therefore the wave structure off the November 6 peak is most likely over. This down leg, if my preferred count is correct, is the wave (A) of the last Zig Zag from the September 14 high. Therefore I am expecting a multi-day bounce followed by a lower low that should complete the corrective EWP (Recall that I am working with a Triple Zig Zag) from the September 14 high with positive divergences.

The internal structure of this bounce at the moment suggests that price may unfold a Double Zig Zag, in which case the common extension targets are:

1 x 1= 1369
1 x 1.618= 1380

A counter trend bounce always entails risks since the EWP can easily morph into something else, so next Monday I would like to see follow through to the upside or at least price should not breach the initial higher low at 1351.06.

In order to keep the ball running to the upside, bulls need price above the 50 wma = 1366.85 by next Friday, theoretically it looks like an easy task.

sp 500 chart

Therefore the extreme oversold readings of breadth & momentum Indicators + logical level for a short-term bottom (0.618 Retracement) + reversal pattern are the “ingredients” that should allow a multi-day rebound.

sp 500 weekend chart

In the daily chart below I highlight the target box for the assumed wave (B) countertrend bounce with a range 1382 – 1402.

A weak bounce should fail at the 200 dma while a strong one will go deeper inside the box and two trend lines resistance could come into play.

sp 500 weekly update chart

So the good news for the short-term bullish case is that there are enough technical reasons that auspicate a larger rebound.

But the negatives are still more overwhelming, since in addition to an incomplete EWP there is no sign of a major bottom from breadth-momentum indicator, VIX and sentiment.

Bulls also have the bullish seasonality of a shorter Thanksgiving week, while volume is expected to shrink.

In any case we know the two potential catalyst that are needed for the resumption of the intermediate up trend:

  • US political agreement of the “Fiscal Cliff”
  • Spanish Bailout

In addition since the Operation Twist ends in December, the next FOMC meeting on December 12 will be a major risk event and could be another detonator for a Major Bottom of the equity market.

To become a subscriber, subscribe to our free newsletter services. Our service is free for all.

Continue reading