Free Stock market / Nifty intraday tips, FREE Stock, Commodity & Forex tips

Trade Setup – NSE HAVELLS, KPRMILL & TEAMLEASE

Free nse havells chart calls
Figure 1. NSE Havells Wave chart

NSE HAVELLS – Impulse Rally on the Horizon!

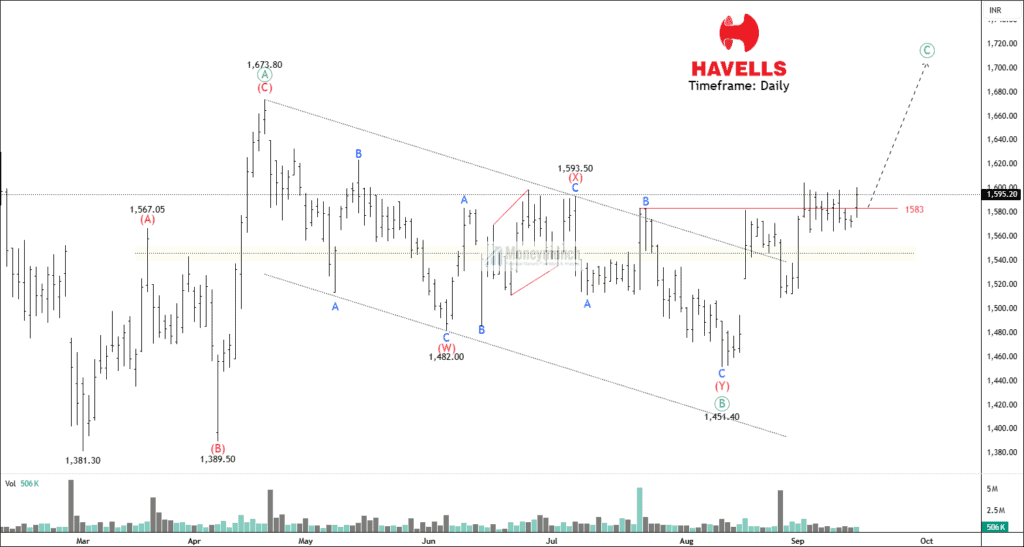
After hitting a low of 1381.3, the price has begun forming a corrective A-B-C pattern and has broken above the 50, 100, and 200-day EMAs. The ATR of 28.75, combined with an ADX of 17.4, indicates low trend strength and moderate volatility. The price has also broken out of the corrective pattern with an upsurge.

NSE HAVELLS completed wave C of (Y) of ((B)) at 1451.4 and has since begun rising in an impulsive cycle. To confirm this impulse, the price must break 1593.5 and sustain above 1583. For short-term and intraday traders, a long entry near 1588 can be considered with targets at 1604 – 1615 – 1628+. A breakout above wave X could further extend the rally toward 1625 – 1662 – 1686+.

NSE KPRMILL – Is the Price Gearing Up for a Breakout Rally?

On the Daily chart, the price has completed wave C of the corrective pattern at 946.5. The ATR is 34.15 and the ADX is 21.48, showing moderate volatility with improving trend strength. The price shows long-term bullish strength above the 200 EMA but faces short-term resistance at the 100 EMA.

NSE KPRMILL is trading in a price range of 1030948. If the price sustains above 1028, traders initiate long for the following targets: 1060 – 1100 – 1135+. Free subscribers can take the previous day’s low as an invalidation level.

NSE TEAMLEASE – Premium Setup

Get free important share market ideas on stocks & nifty tips chart setups, analysis for the upcoming session, and more by joining the below link: Stock Tips

Have you any questions/feedback about this article? Please leave your queries in the comment box for answers.

Disclaimer: The information provided on this website, including but not limited to stock, commodity, and forex trading tips, technical analysis, and research reports, is solely for educational and informational purposes. It should not be considered as financial advice or a recommendation to engage in any trading activity. Trading in stocks, commodities, and forex involves substantial risks, and you should carefully consider your financial situation and consult with a professional advisor before making any trading decisions. Moneymunch.com and its authors do not guarantee the accuracy, completeness, or reliability of the information provided, and shall not be held responsible for any losses or damages incurred as a result of using or relying on such information. Trading in the financial markets is subject to market risks, and past performance is not indicative of future results. By accessing and using this website, you acknowledge and agree to the terms of this disclaimer.
Previous ArticleNext Article
Mr.Guru(s) is a team of stock market certified technical and research analysts with over 20 years of experience. They are regular guests on popular online channels and contribute articles to several financial publications. Their insights and advice are respected by investors worldwide. With their collective knowledge and expertise, they have a proven track record of successfully predicting market movements and identifying profitable opportunities.

Join Today (Free): Stock & Nifty Tips

4 Comments

  1. Your chart prepare too good explanation. I want to learn this technique. Do u provide any courses???

Write a Comment

Comment Policy: We love comments and appreciate the time that readers spend to share ideas and give feedback. However, all comments are manually moderated and those deemed to be spam or solely promotional will be deleted. Your email address will not be published. Required fields are marked *