Timeframe: Daily
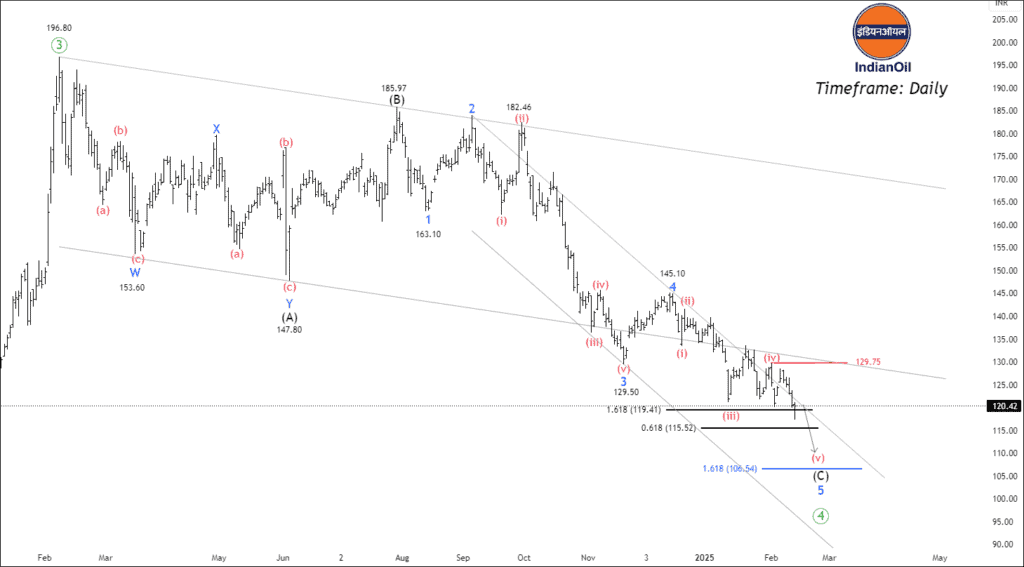
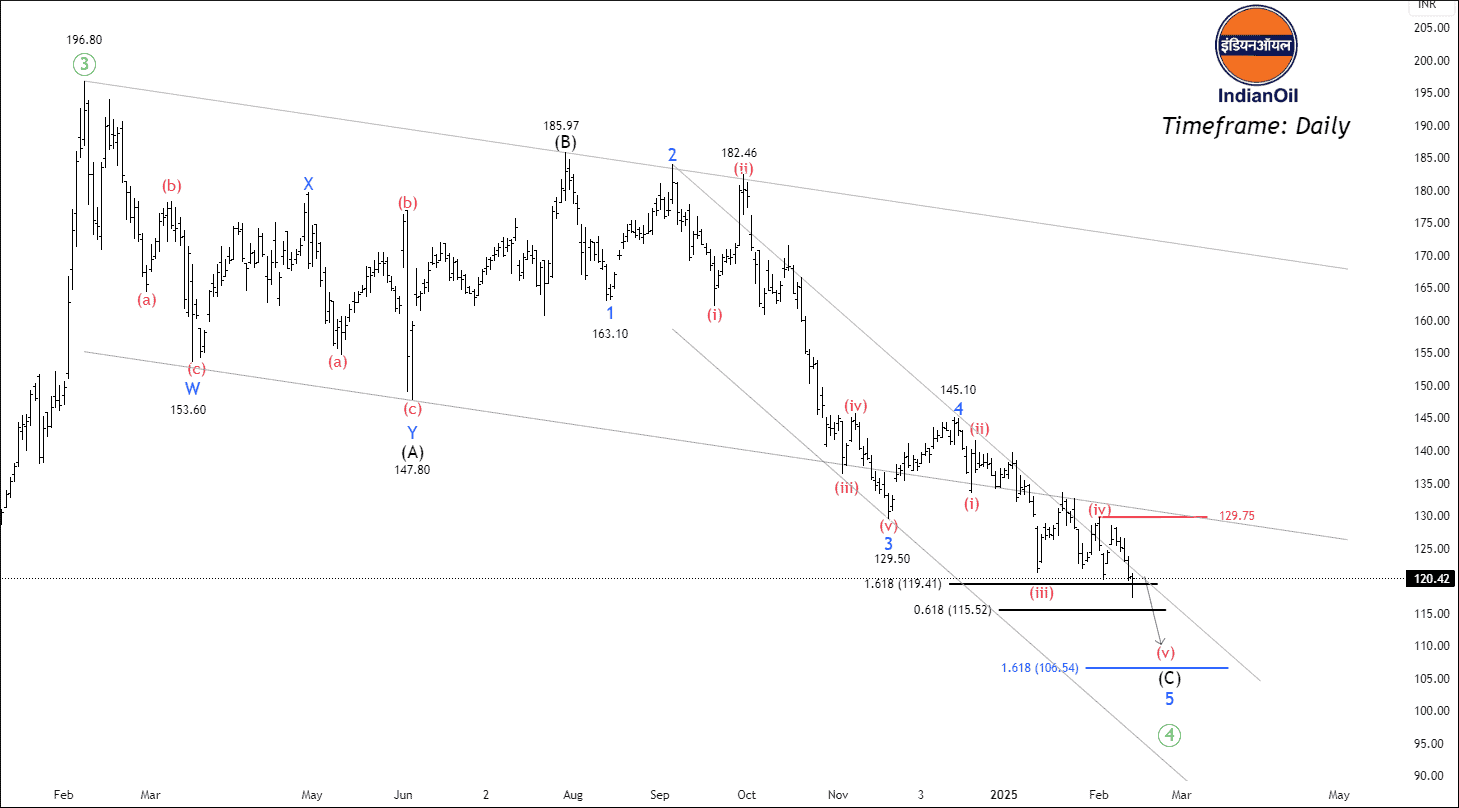
After reaching a high of 196.8, the price has declined by over 39% in 13 weeks. It is currently trading below the 50/100 EMA band, with ATR at 3.68 and ADX at 26.02. According to the Elliott Wave projection, the peak of 196.80 can be identified as a wave ((3)). The security is currently undergoing the formation of a corrective wave (4).
Wave (B) formed at 185.97, while wave 4 of wave (C) was completed at 145.10. NSE IOC is now setting up for the final wave 5 of wave (C).
Two key Fibonacci relationships help estimate the end of the correction:
- 1.618 Fibonacci extension of wave (A) at 106.54 (for wave C)
- 0.618 Fibonacci extension of wave 1 at 115.52 (for wave 5)
The price is expected to settle between 115 and 105, which serves as a key demand zone for buyers. If the price breaks out and sustains above 129.75, traders can target the following levels: 139 – 156 – 172+.
Only premium subscribers will get trade setup with entry, exit, and invalidation levels.
Get free important share market ideas on stocks & nifty tips chart setups, analysis for the upcoming session, and more by joining the below link: Stock Tips
Have you any questions/feedback about this article? Please leave your queries in the comment box for answers.
Impressive breakdown of the trend!
Love the clarity in your analysis! 💯
Brilliant analysis! The way you’ve mapped Elliott Waves with Fibonacci precision is truly impressive.
I must say, this analysis is incredibly detailed and well-thought-out! The way you have connected the wave structure with potential targets shows a deep understanding of the market.
Hi, I am interested in purchasing your premium plans. Could you please provide more details about the features and pricing? Looking forward to learning more!
Thank you for your interest in our premium plans! We have multiple plans tailored to different trading needs. You can check the detailed features and pricing here: https://moneymunch.com/our-service/
indian oil corporation/BPCL
is my favourite stock. considering the debt in Central government–geting support form government will not be easy. buy this share if one has TO KEEP IN HOLDING FOR 10 YEARS. I HAVE A PLAN TO 10 SHARES MONTHLY BASIS APPROXIMATELY 1500 SHARES IN 5 YEARS. RISK IS there but lesser, cg power my tgt 402