

Timeframe: Daily
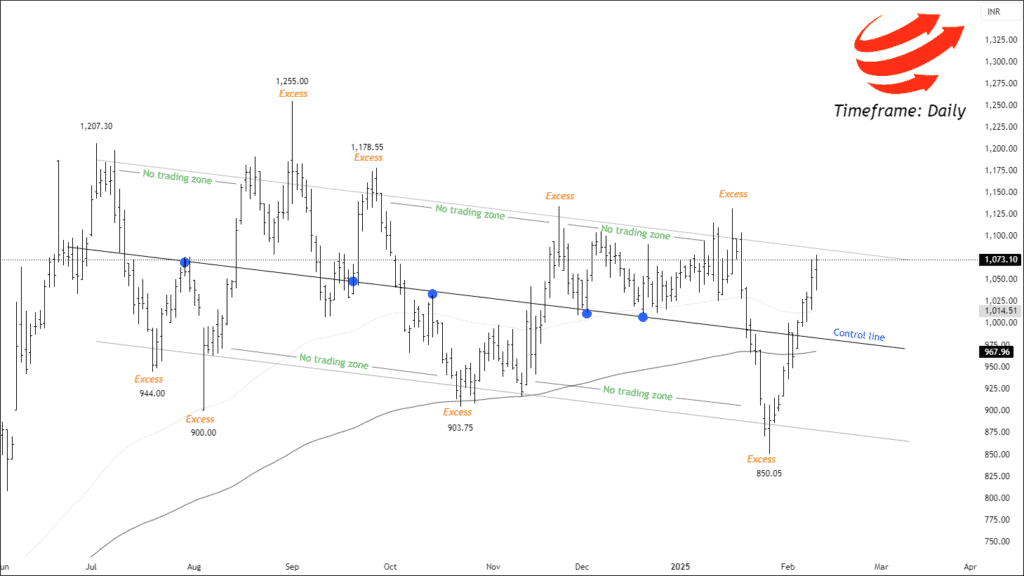
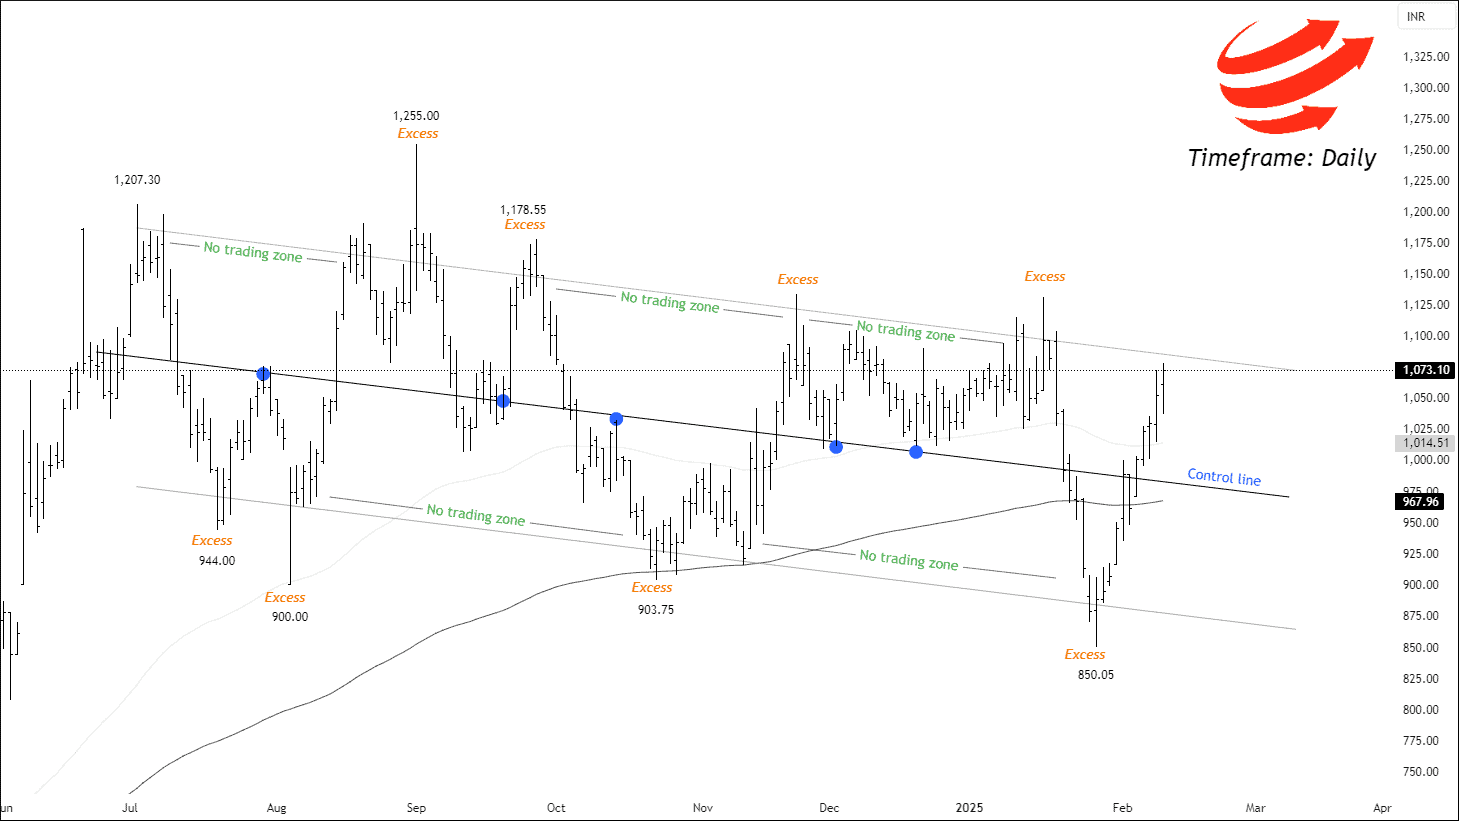
UNOMINDA on the NSE has been trading within a descending value area for over 30 weeks. Currently, the price is positioned above the 200 and 100 EMAs, with the ADX set at 21 and the ATR at 43.73. The price has made 9 touches on the control line, resulting in 5 significant reversals. The upper band shows three no-trading zones, while the lower band has two. The longer zone length on the lower band suggests that buyers are attempting to break the range but are consistently unable to surpass the selling pressure.
Each time the price breaks out of the channel, it quickly reverses with the following bar and re-enters the channel. On average, reversals from the upper band to the lower band take around 26 days. However, the current V-shaped recovery has completed this reversal in just 14 days, indicating increased volatility and momentum.
The price is currently in the upper band of the channel. If an excess forms, traders may consider selling the stock, targeting the lower band of the channel. In the event of a breakout, the price will likely attempt to retest the control line. To confirm a genuine breakout, the subsequent bars should display strong momentum, helping to avoid a false breakout scenario.
We will update further information for premium subscribers soon.
Get free important share market ideas on stocks & nifty tips chart setups, analysis for the upcoming session, and more by joining the below link: Stock Tips
Have you any questions/feedback about this article? Please leave your queries in the comment box for answers.

Nice! Momentum indicators aren’t showing enough strength for a solid breakout in my opinion.
Thanks for accurate information
Solid breakdown of the technicals! Keeping an eye on this for sure.
Keep up the good work!
Fantastic insights!
About my experience
Delta corp @64 is nice buy
What do you want to say sir!