
Timeframe: 4h
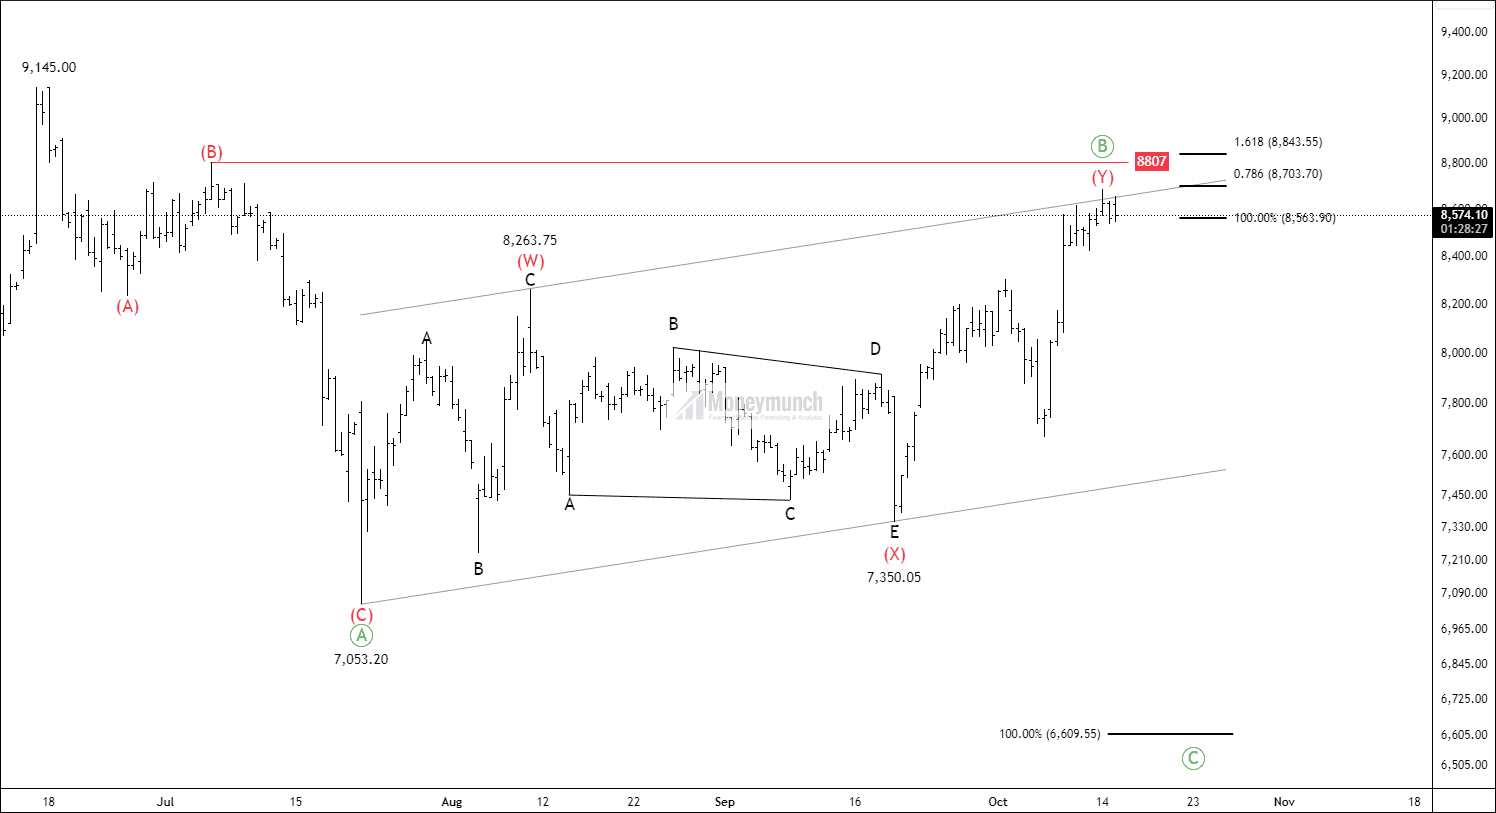
On the daily 4-hour chart of NSE ABB, a corrective pattern has taken shape. The stock has formed an A-B-C structure where wave (A) appears as a zigzag, wave (B) as a double three formation, and wave (C) is still in development. Currently, the price is trading above 200/100/50 EMA. The key question is whether the move has already occurred or is still pending.
Wave (Y) has reached 100% retracement of wave (W), so wave (W) = wave (Y) at 8563. Wave ((B)) has retraced 78.6%, indicating that we can anticipate wave ((C)) to extend to 100-127%, as the overall formation is expected to be flat. There are more than three clusters suggesting that wave ((B)) could potentially complete around the 8843 level.
For wave ((C)), We can anticipate a maximum extension of 100% of wave ((A)) at the 6609 level. Bullish sentiment will emerge if the price holds above wave B, but this seems less likely due to the choppy nature of the current formation. After completion of wave ((B)), traders can expect the following targets: 7854 – 7359 – 6841.
We will update further information for premium subscribers soon.
Get free important share market ideas on stocks & nifty tips chart setups, analysis for the upcoming session, and more by joining the below link: Stock Tips
Have you any questions/feedback about this article? Please leave your queries in the comment box for answers.
Thanks for sharing your view
Good chart, Sir, FINNifty ka koi view he apka?
your efforts are valuable for us ..❤️❤️❤️