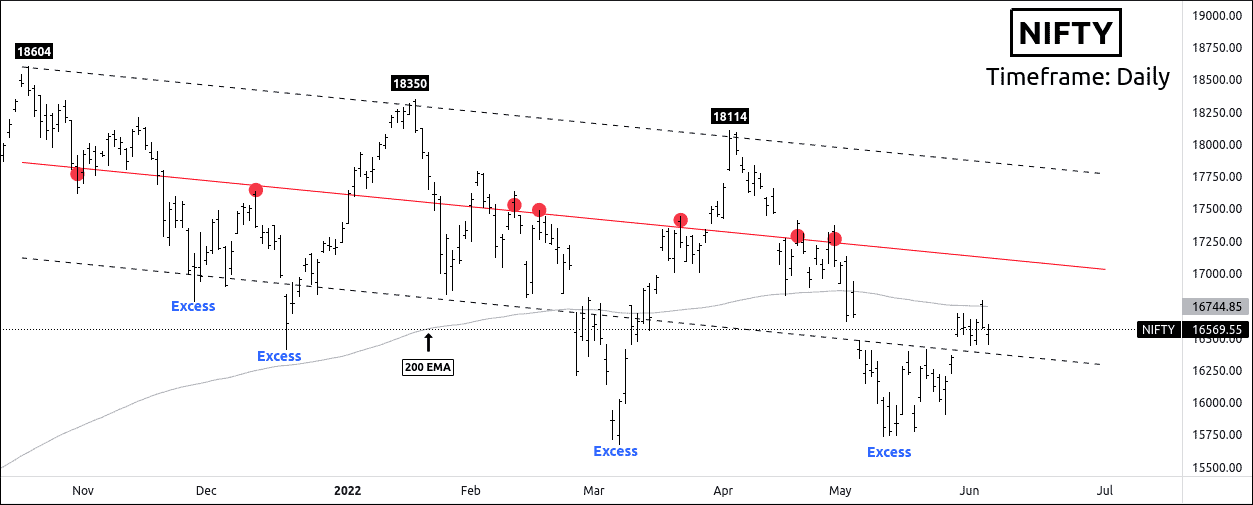
Timeframe: Daily
Sellers are aggressive when price inters in the overbought zone. Price hasn’t made an excess on the upper band of the parallel channel. After entering the parallel channel and making a higher low, nifty has shown bullish momentum. It has made a recent high of 16793 and faced resistance from 200 EMA with a big bearish belt candle.
16860 is the key level for bull traders. If the price breaks this level, it can go up to the control line at 17100 and above.
Rejection from the pivot level indicates extreme bearishness, and it will drive nifty below 15910.
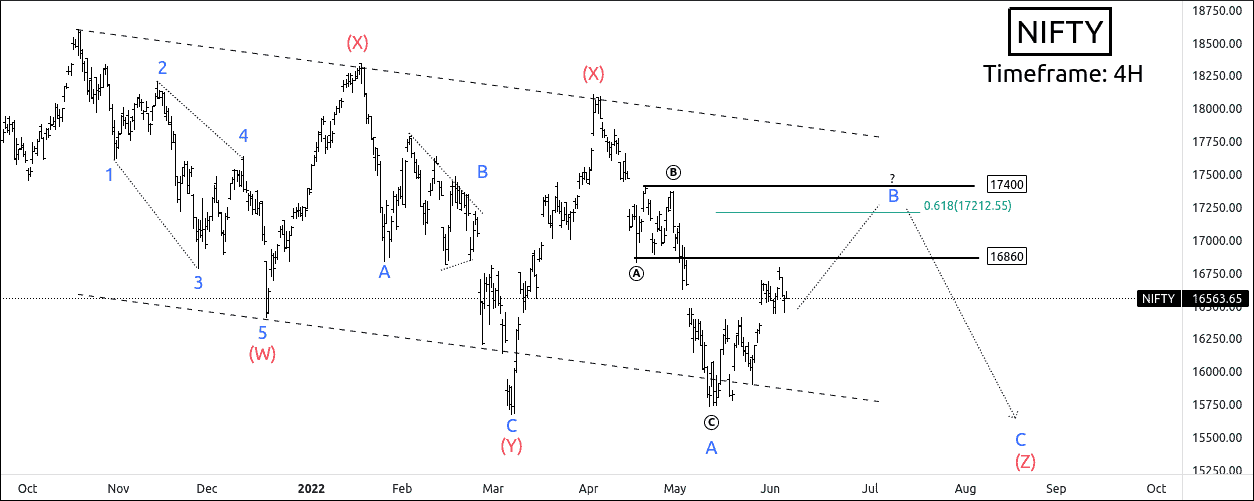
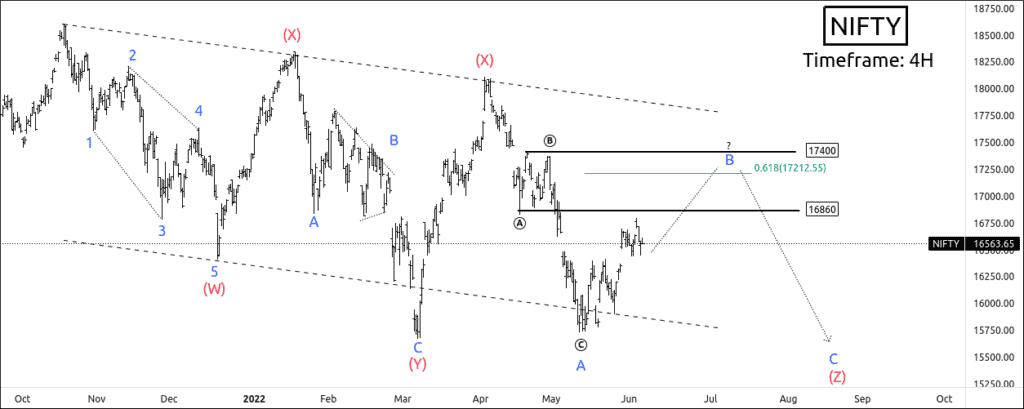
Timeframe: 4H
Nifty has completed wave A of triple three combination W-X-Y-X-Z. 16860 is pivot and flip-flop level for us. If the price breaks it, nifty can move up to 17100-172010. if it starts marching in an upward direction, trade can use a trail stop loss.
However, 17400 is a strong resistance.If bulls fail to break 16860, they will not even reach 17200
After the accomplishment of wave B, the price will fall for impulsive wave C of correction.
Traders can trade wave C for following targets: 16250 – 16000 – 15800
If bulls have to change the trend, they must break wave b at 17400. Bullish move is only possible above 17400.
To become a subscriber, subscribe to our free newsletter services. Our service is free for all.
 Unlock This Article
Get free important share market ideas on stocks & nifty tips chart setups, analysis for the upcoming session, and more by joining the below link: Stock Tips
Have you any questions/feedback about this article? Please leave your queries in the comment box for answers.
Thank you for your analysis. I have made a good profit in the previous month. Keep sharing this analysis.
Fantastic. Easy to understand and accurate analysis. Thanks
. The monthly reports speak about your accuracy. I am interested in premium services, but I want your help to select premium plans