
Timeframe: Daily
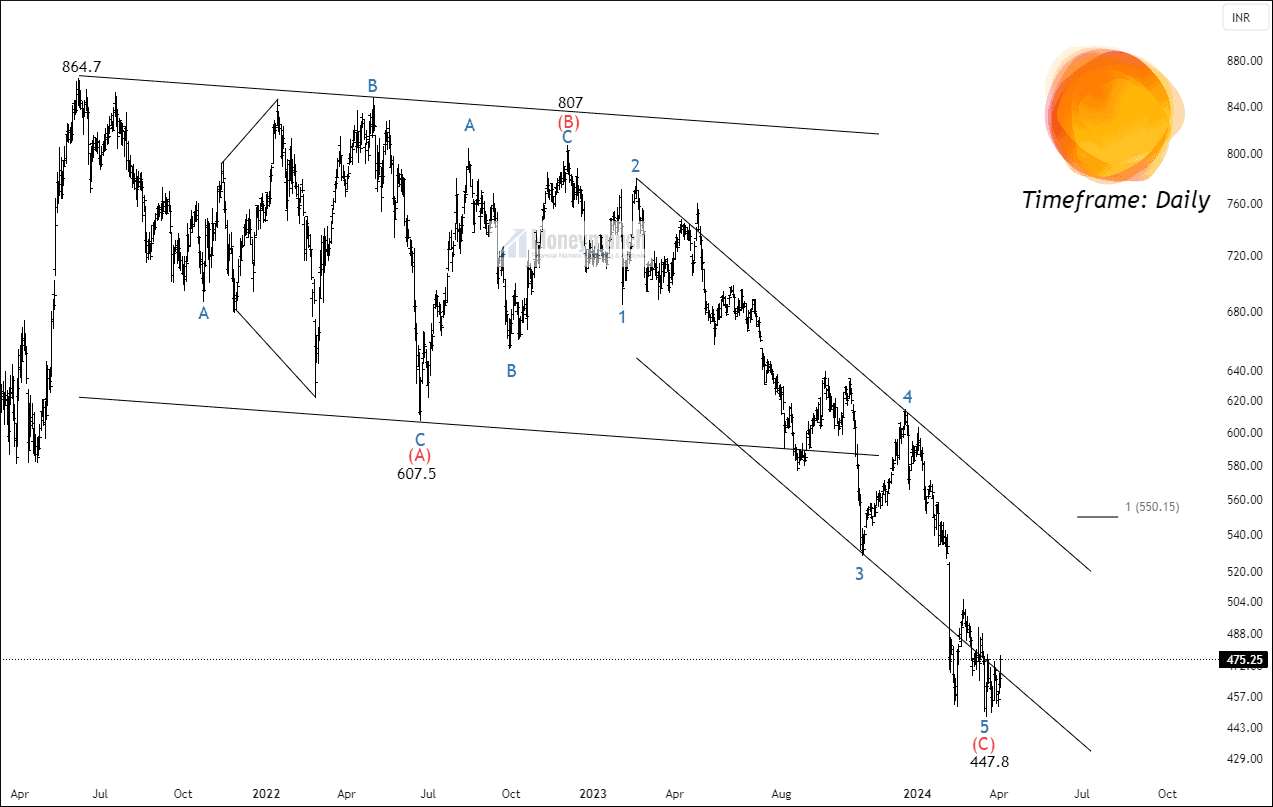
After reaching its peak at 864, NSE UPL has experienced a significant decline of over 48% over a span of 145 weeks. Currently, its prices have dipped below the 50/100/200 EMA bands, indicating a bearish trend. Additionally, the strength of the downward movement has diminished as the ADX (10D) has fallen below 19.
Applying the Elliott wave principle, it appears that the price has formed a corrective pattern. Wave A seems to have occurred at 607, followed by wave B at 807. Sub-wave V of 5 of wave (C) appears to have completed its structure at 407.8. A new cycle is anticipated to commence following the breakout of sub-wave V of 5 of C.
 Unlock This Article
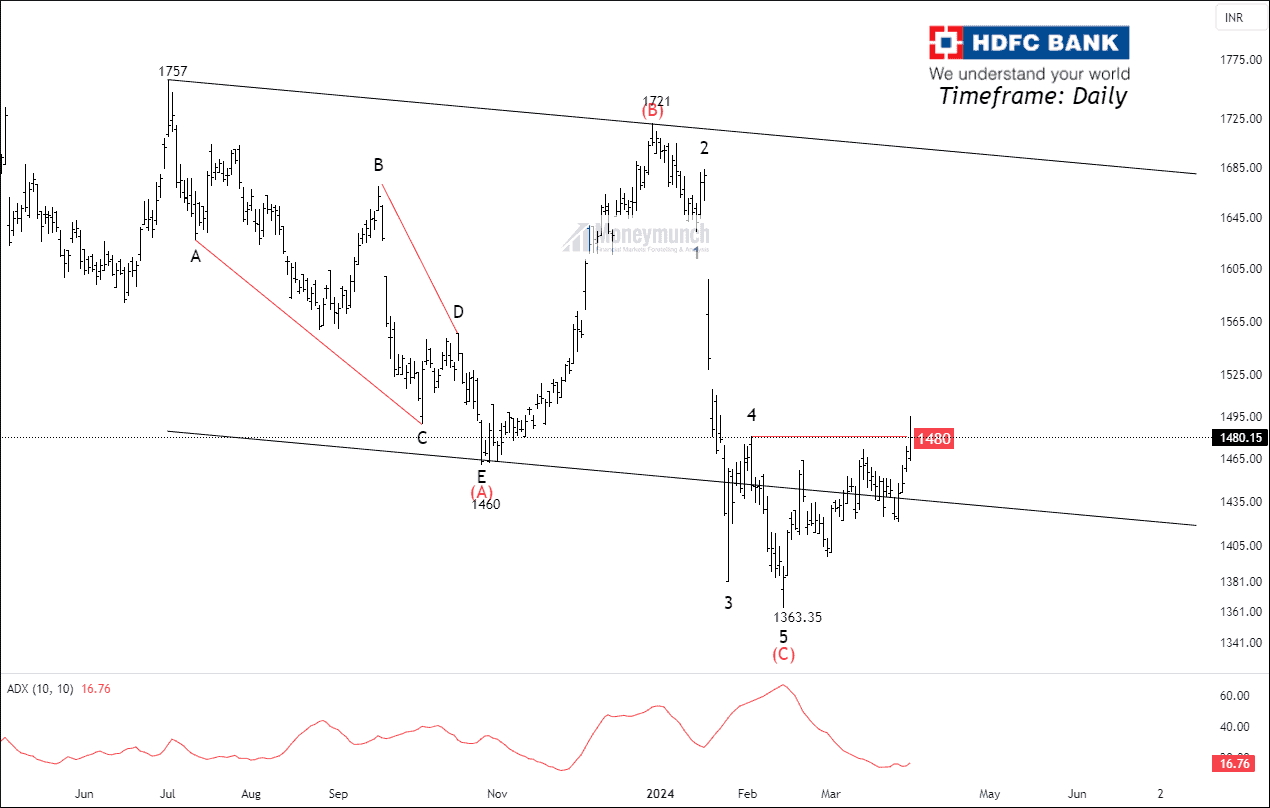
Timeframe: Daily
As per the chart, NSE HDFCBANK has entered the corrective channel after giving a throw-under. The price is resistance from the 35/50 Exponential moving average. The primary issue lies in the decreasing ATR and ADX, as a robust uptrend necessitates a supportive ADX.
Based on the wave principle, HDFC Bank has completed corrective wave (C) at 1363.35. To validate the uptrend structure, the price needs to surpass wave four at 1480.It will be a good entry. It’s advisable to refrain from entering the market unless there’s a robust breakout of the sub-structure. Targets can be projected up to 1600.
We will update further information soon.
UNLOCKED:
Swing Targets: 1522 – 1568 – 1600+.
Get free important share market ideas on stocks & nifty tips chart setups, analysis for the upcoming session, and more by joining the below link: Stock Tips
Have you any questions/feedback about this article? Please leave your queries in the comment box for answers.
Great work :)
Pls share your view on Indus, and adani port