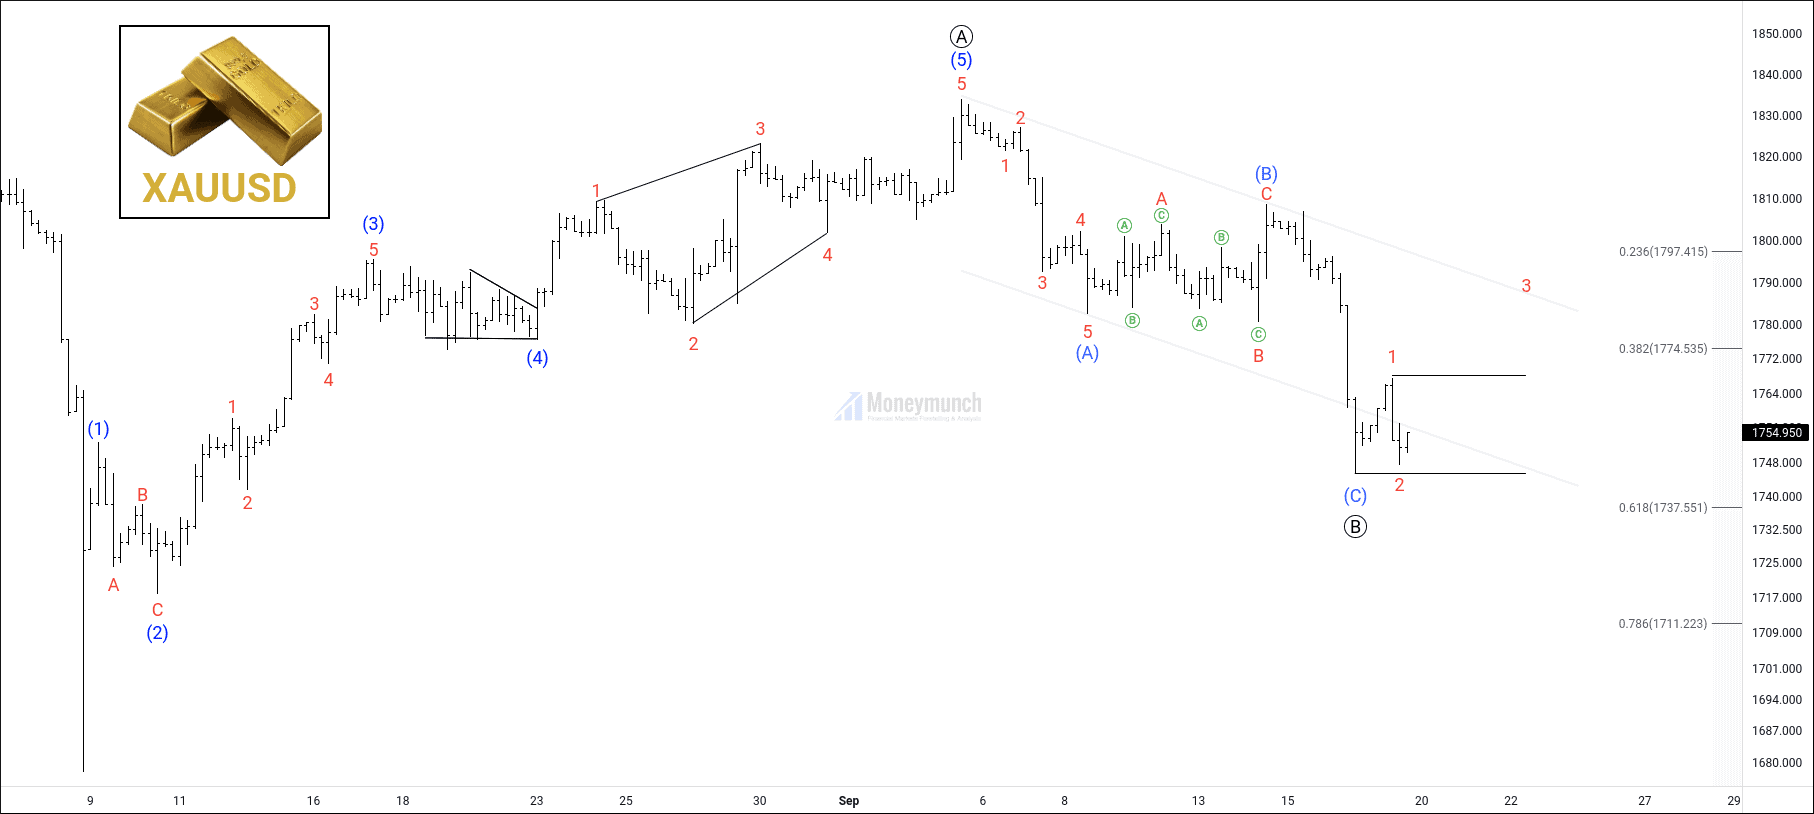
BEFORE
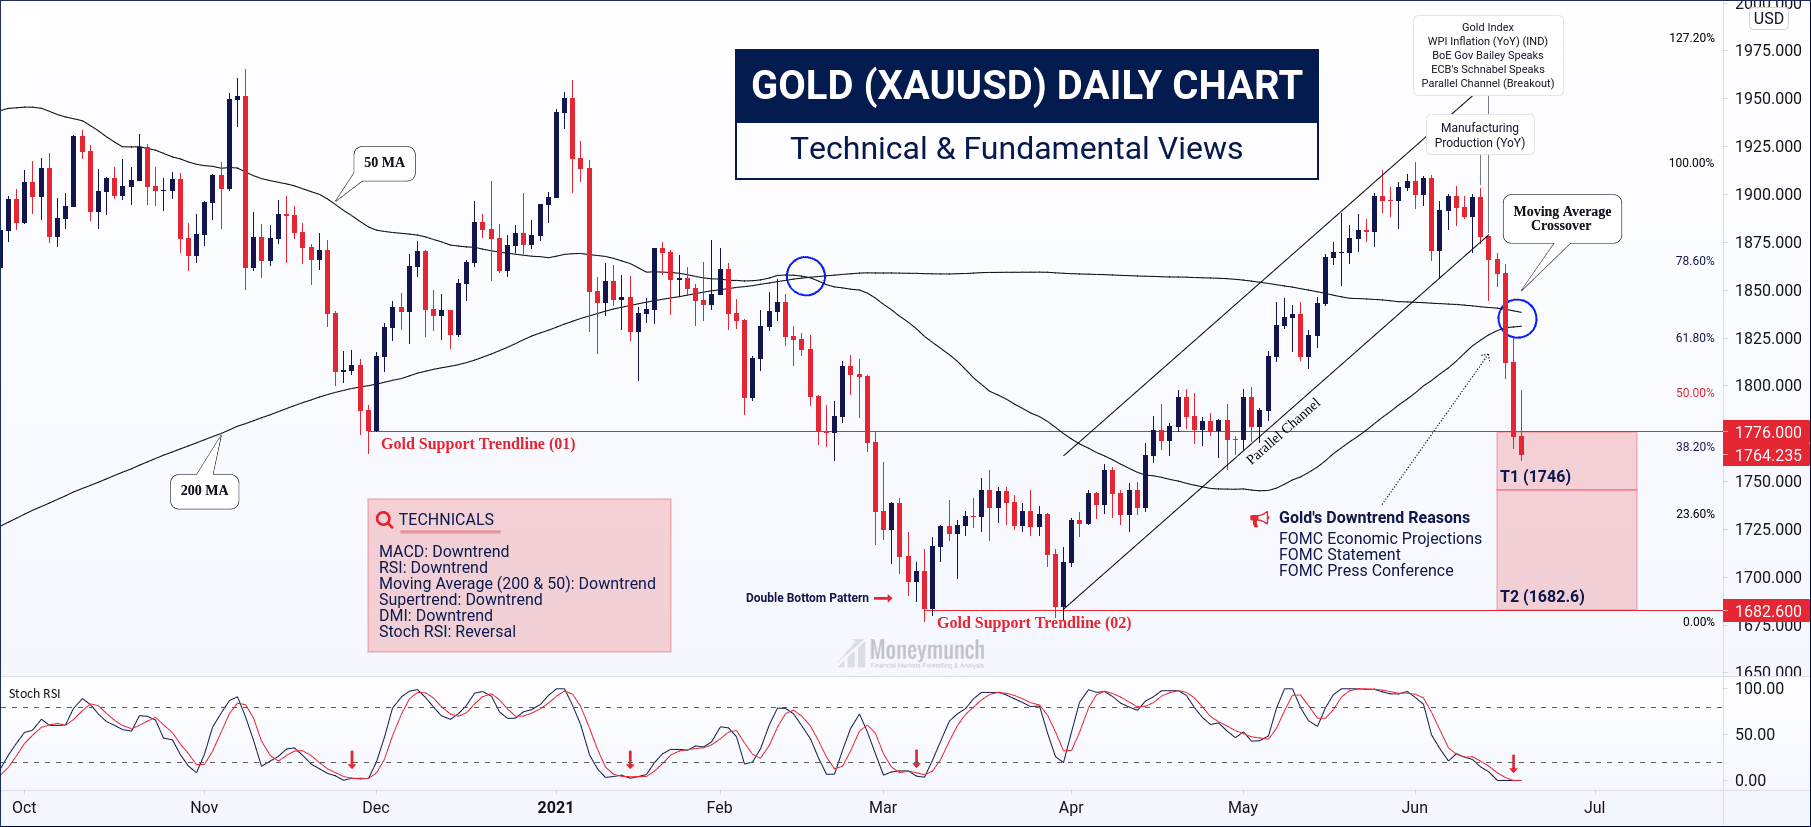
UPDATE: Gold’s Simplified Trading Strategy
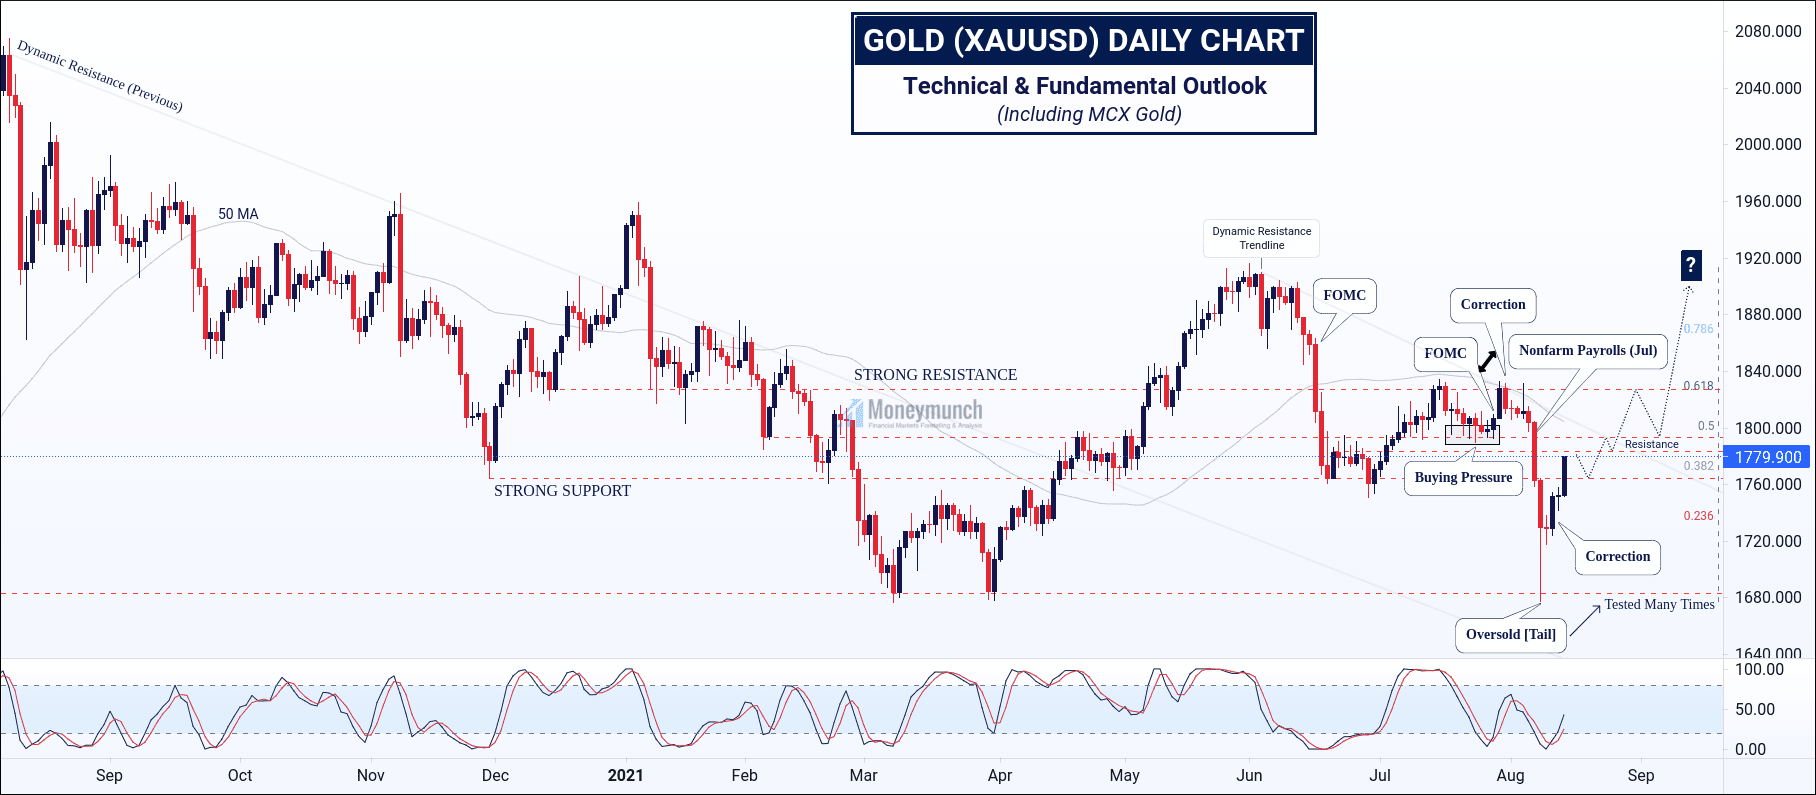
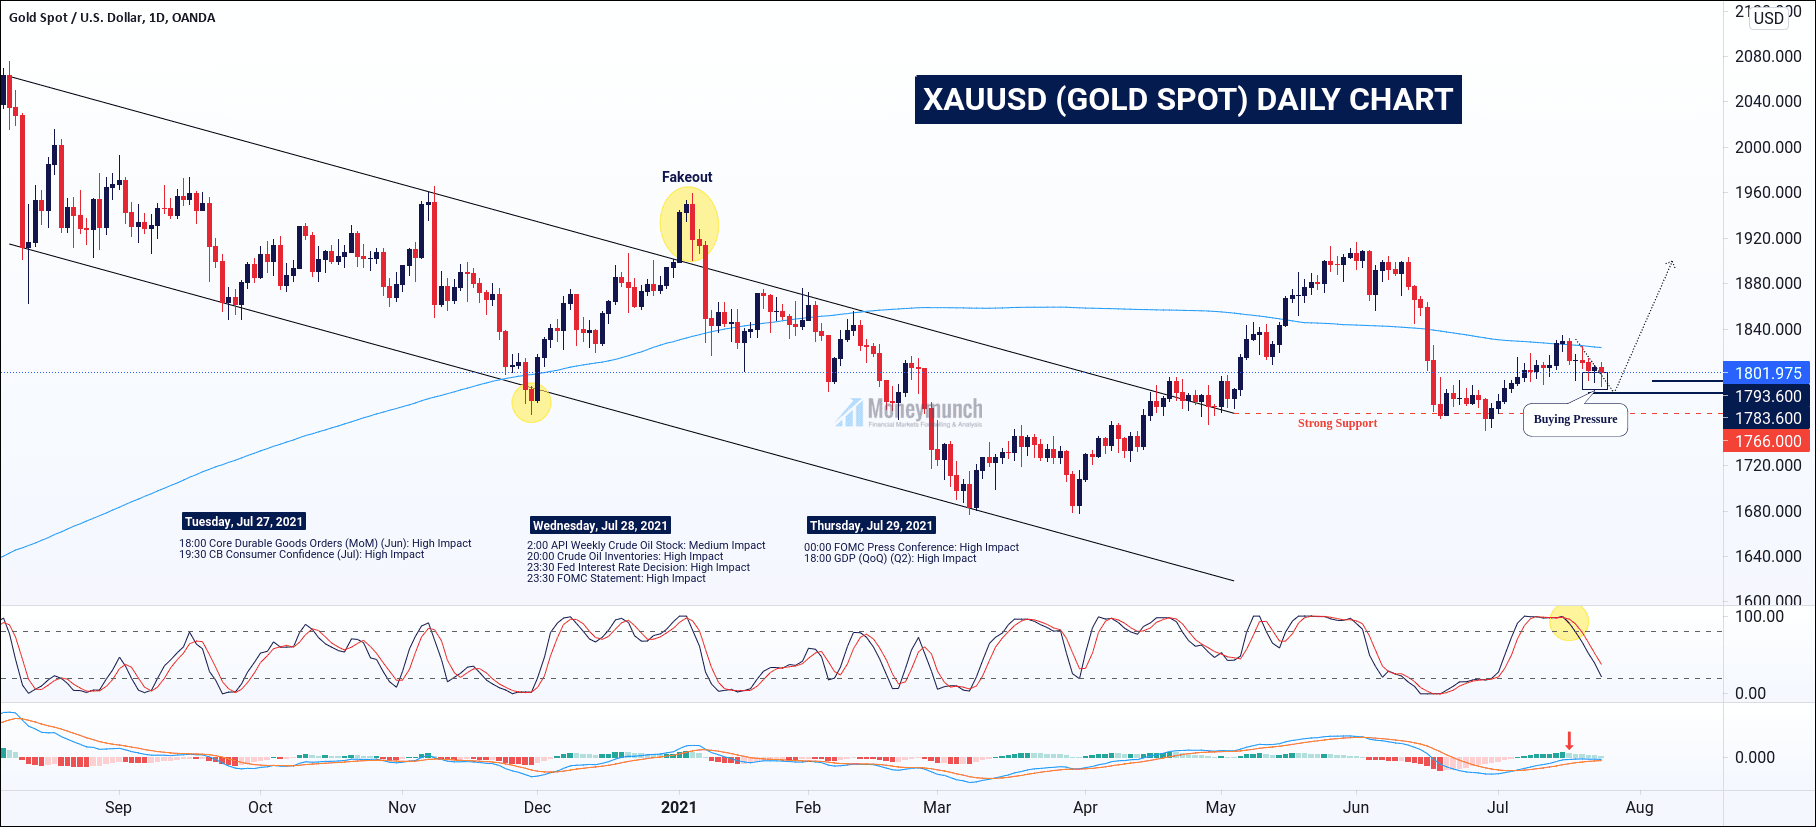
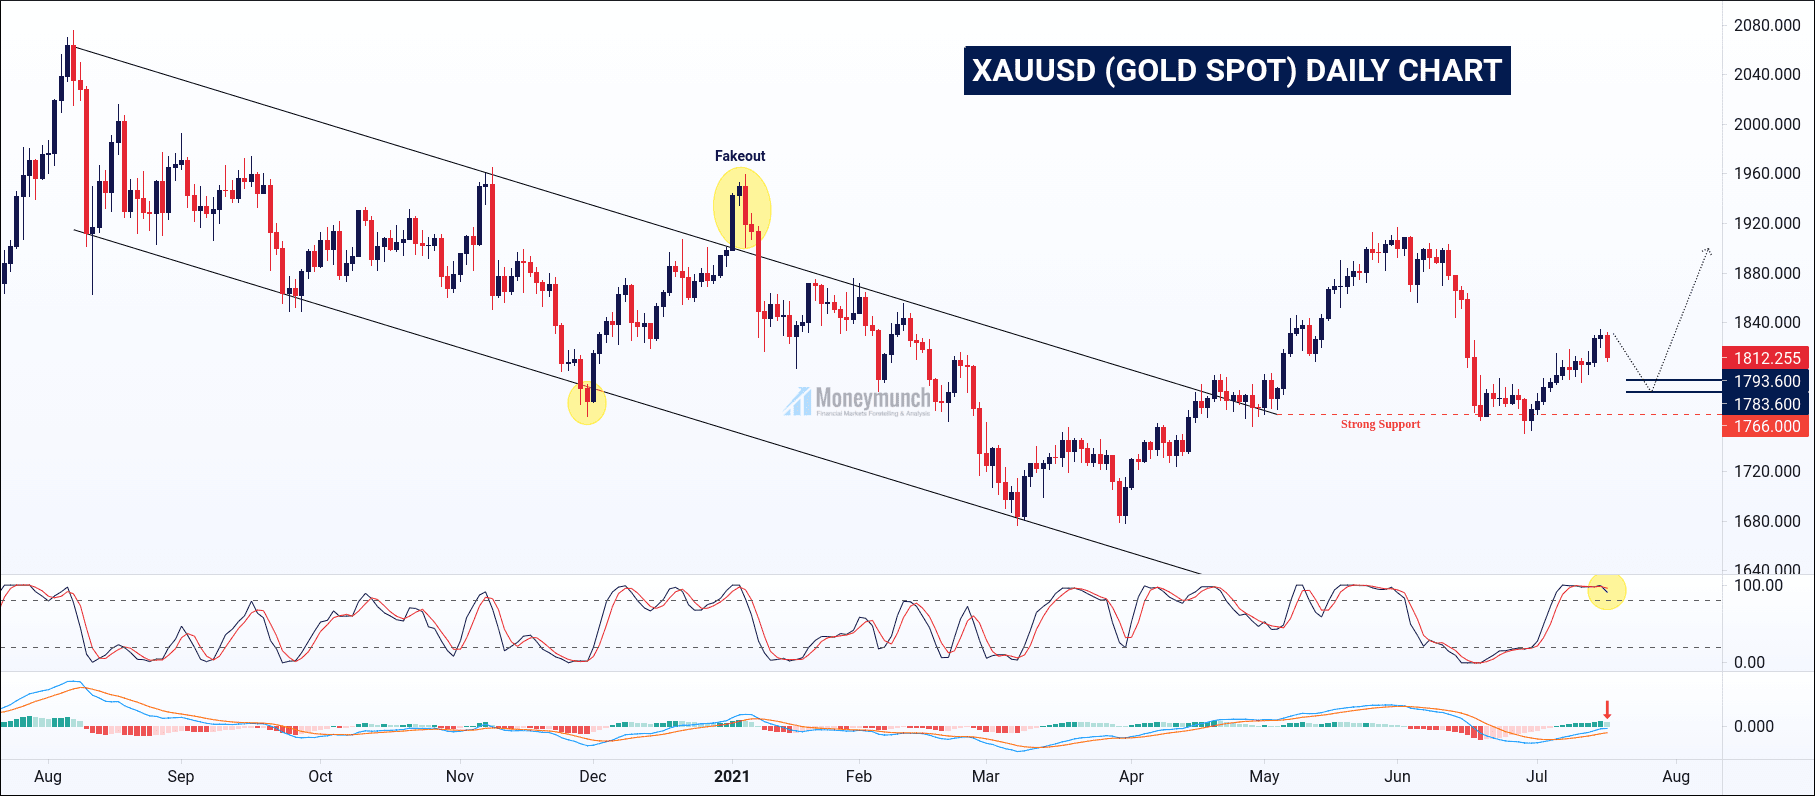
I had written in clear words, “…according to Elliott Wave theory, it was in a corrective wave. It has completed the ABC, and now gold can start marching for a new impulse phase. Therefore, we can expect the gold’s target price 1782 – 1790+“.
AFTER
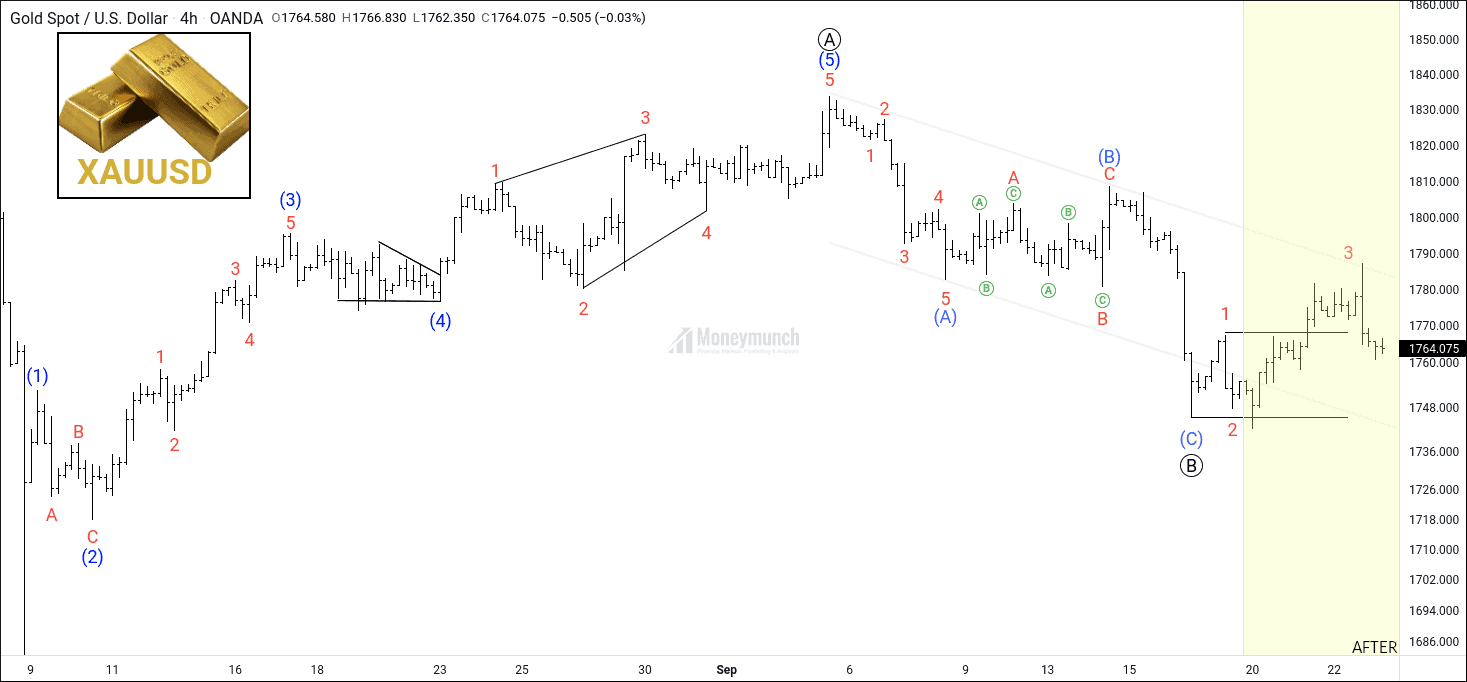
The first target of gold has come. Will it touch the second target?
To read the full article of Gold, Subscribe Now.
Only subscribers can read the full article. Please login to read the entire article.
 Unlock This Article
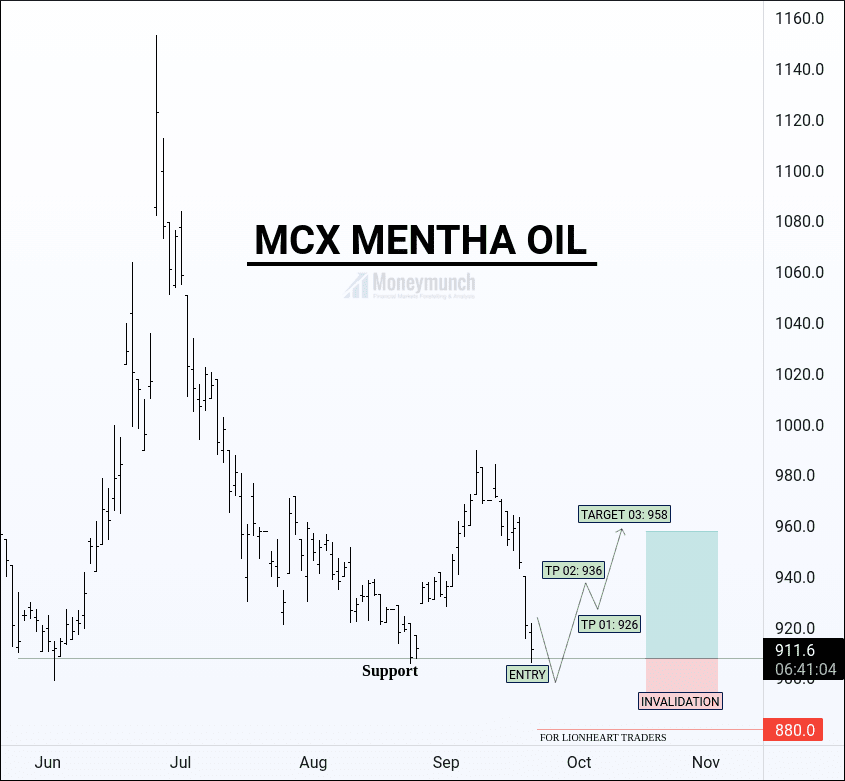
BEFORE
UPDATE: Will Mentha Oil Touch 960 Level Again?
I had written in bold words, “MCX Mentha oil can bounce here. It can retest the 960. The intraday & short-term investors should enter around the support trendline for the targets of 926 – 936 – 958“.
AFTER
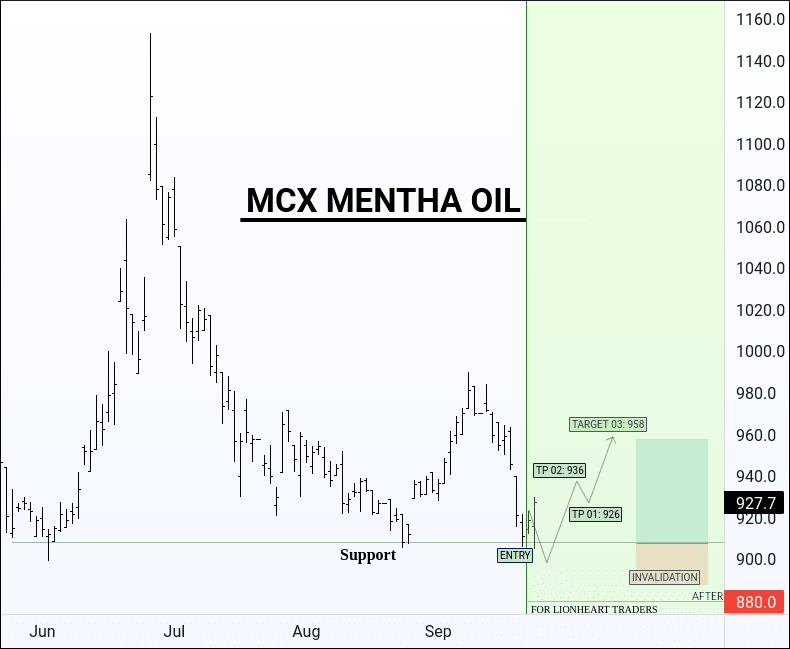
Today it has touched the first target.
Continue reading