
XAUUSD – Corrective Scenario Analysis
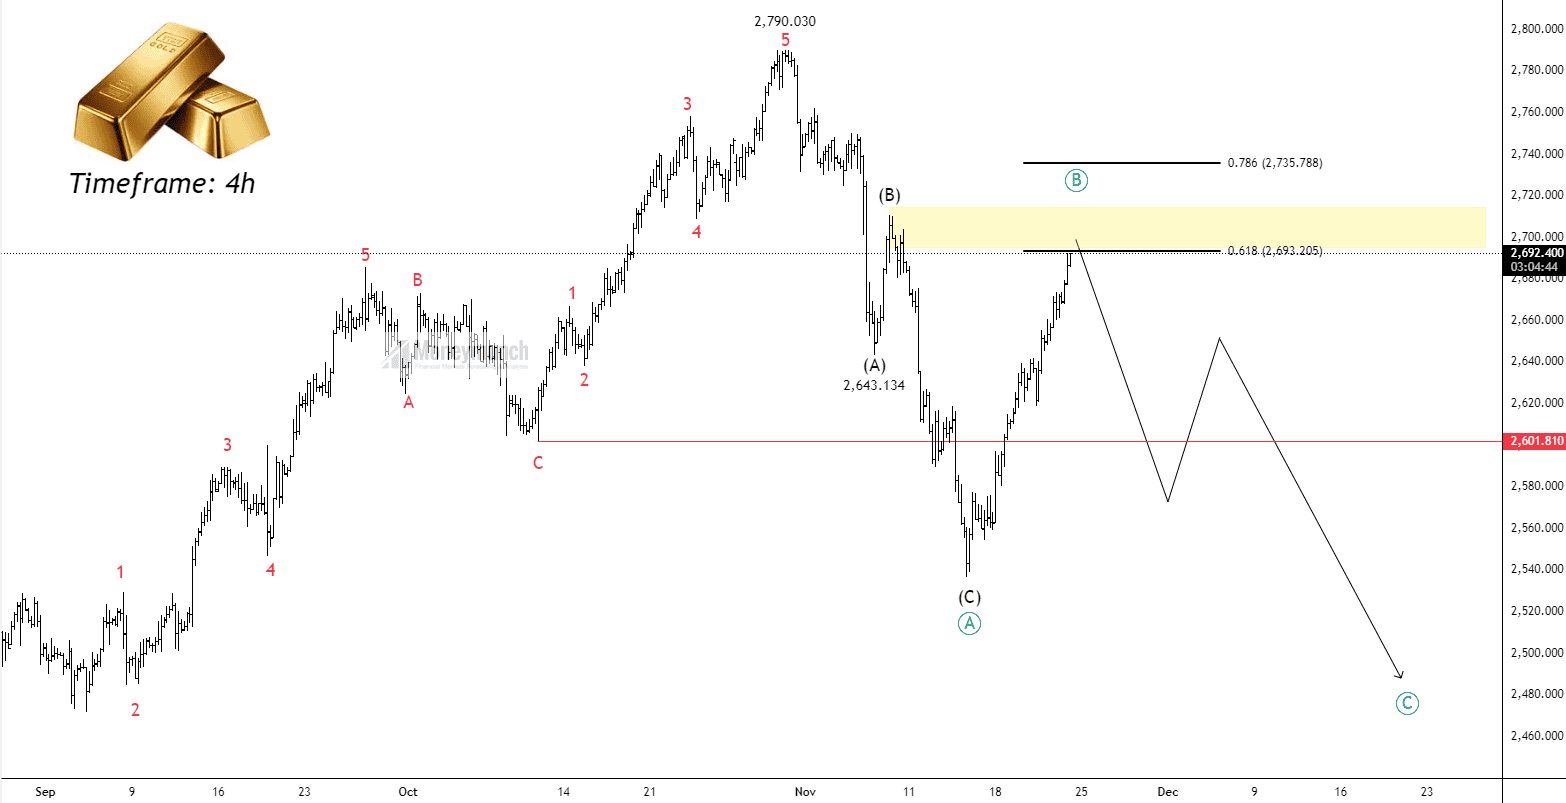
XAUUSD: Corrective Phase Setting the Stage for a Bull Run
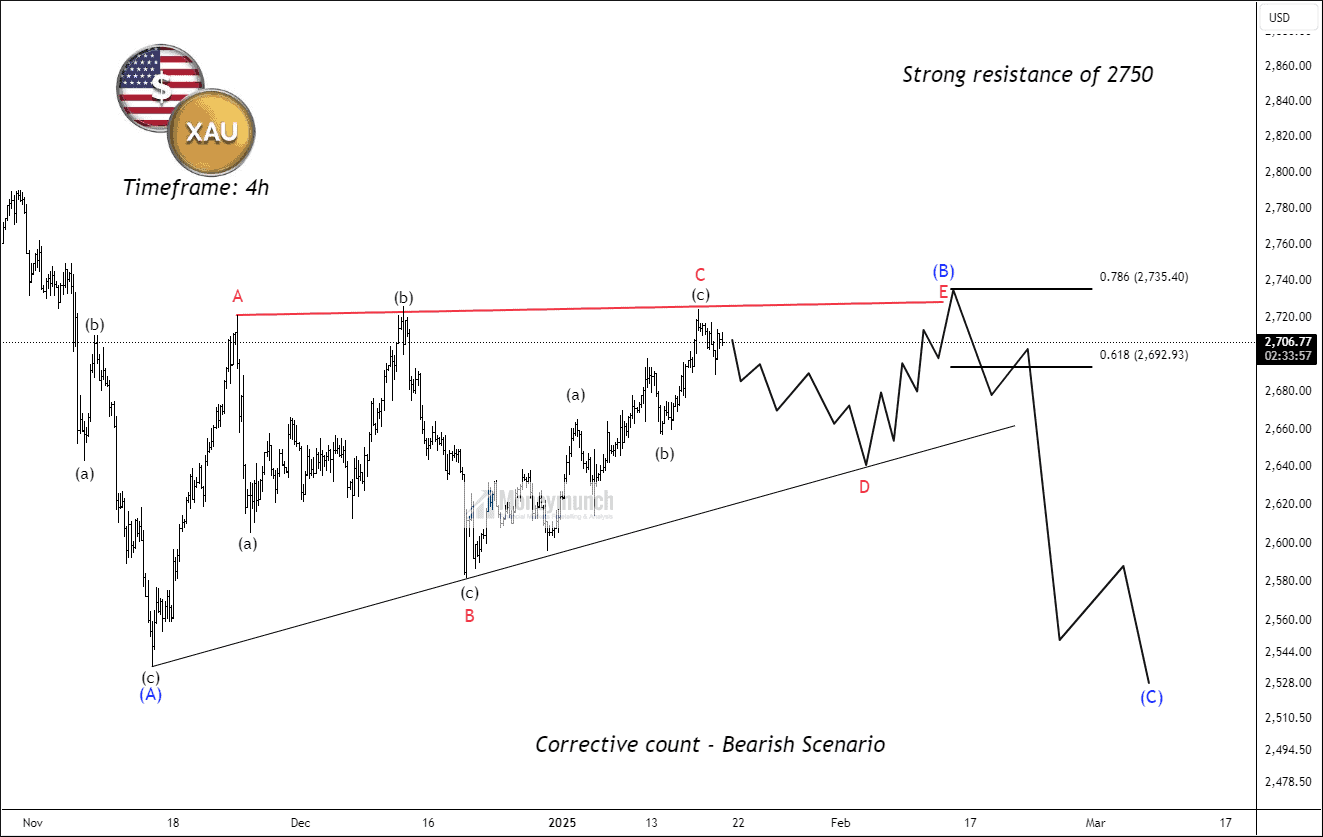
XAUUSD – Bulls Achieve a Decisive Triumph in the Market
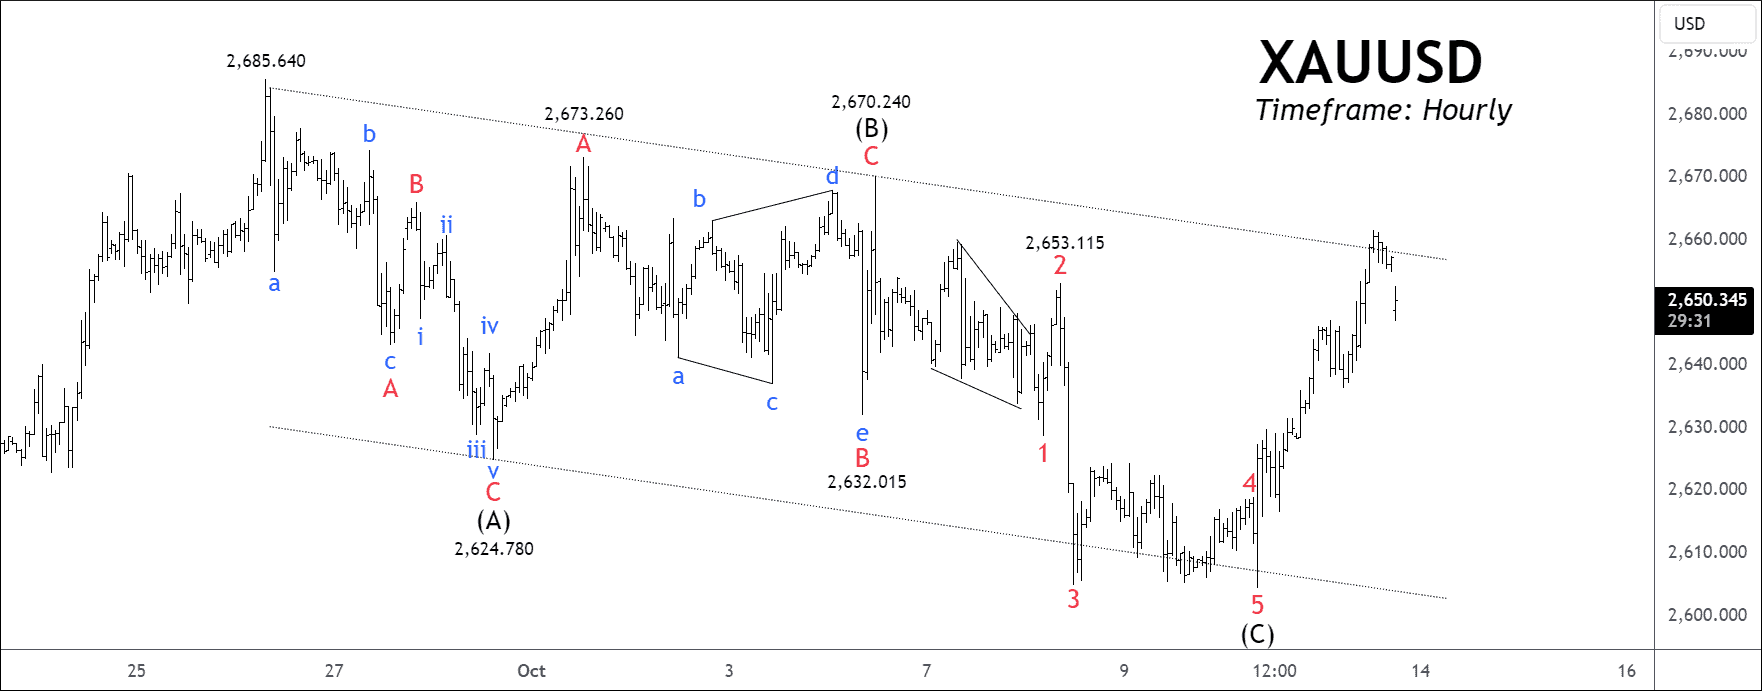
XAUUSD: Final Wave Completion – What’s Next?
Did you trade XAUUSD Wave Setup?
Visit here: XAUUSD: Final Wave Completion – What’s Next?
 BEFORE
XAUUSD: Will Price Hit the Second Target?
XAUUSD: Final Wave Completion – What’s Next?
Did you trade XAUUSD Wave Setup?
Visit here: XAUUSD: Final Wave Completion – What’s Next?
BEFORE