Do you remember the XAUUSD Wave Analysis?
Click Here: XAUUSD Outlook – Thrust of the Triangle
 BEFORE
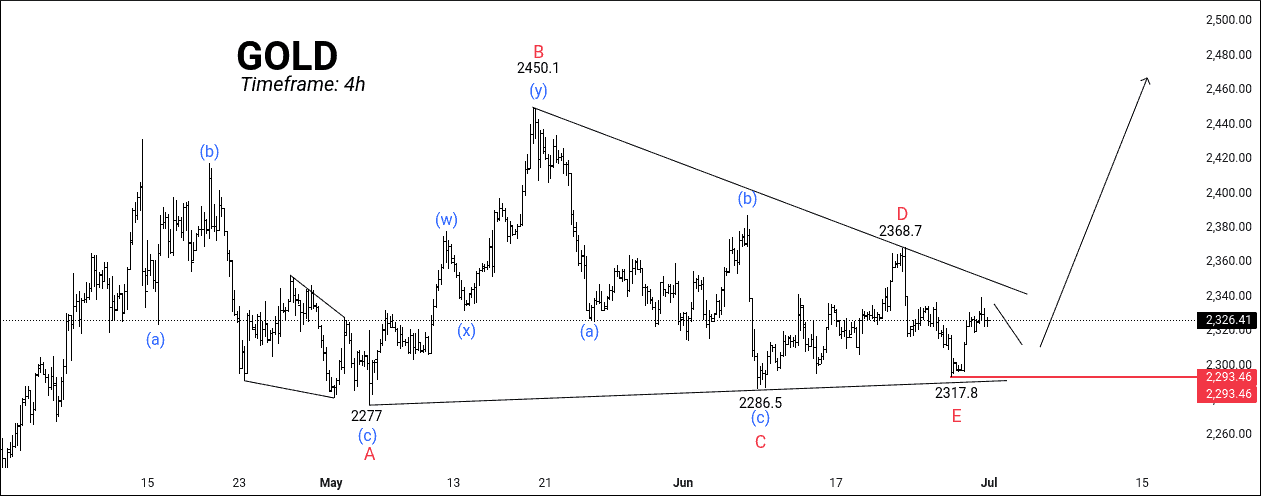
I have written clearly, “Potential targets for this setup are 2368 – 2395 – 2444.7+.”
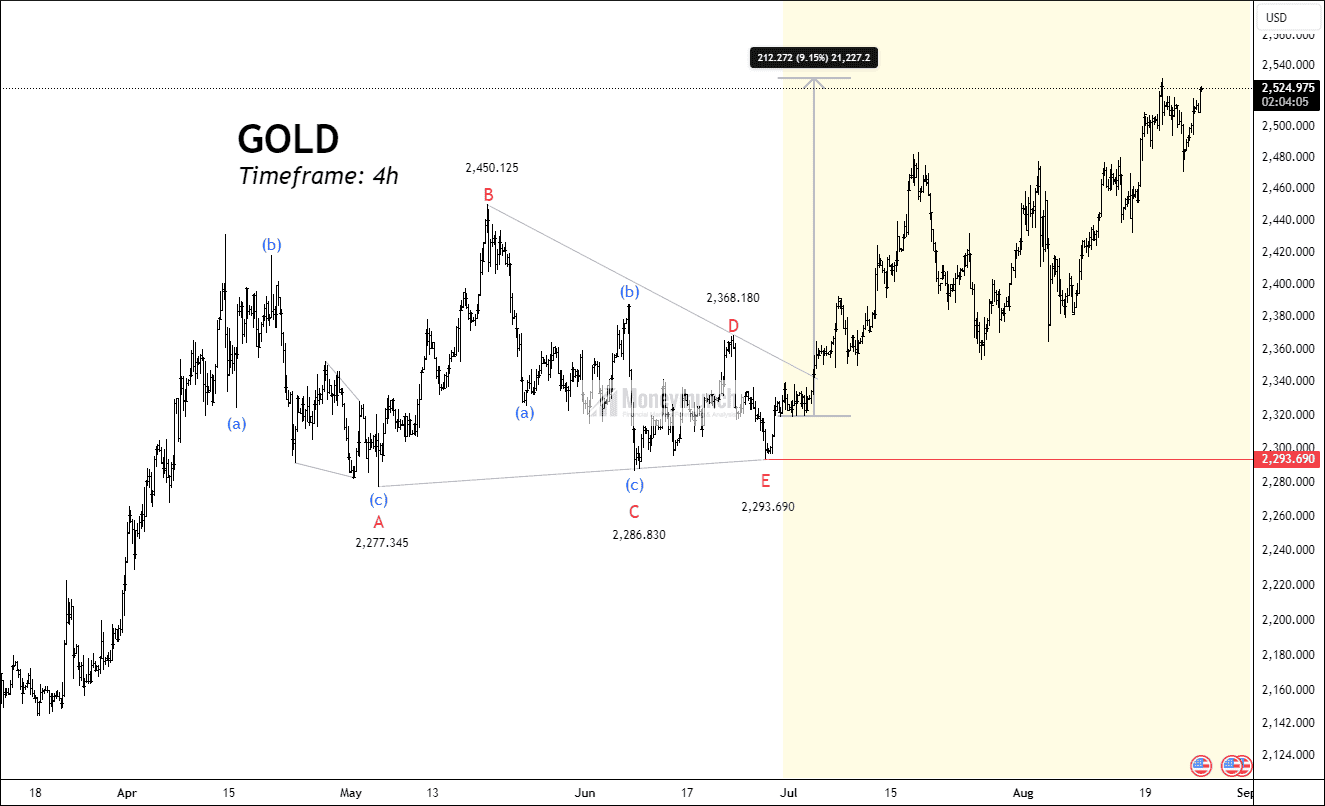 AFTER
AFTER
Looking for reliable forex trading signals and analysis for the XAUUSD (gold spot) pair? Look no further than Moneymunch! Our team of experts provides free technical and fundamental analysis, research reports, and daily or weekly charts to help you stay ahead of the game. Subscribe now and get the latest XAGUSD (gold) forecast and signals straight to your inbox!
Do you remember the XAUUSD Wave Analysis?
Click Here: XAUUSD Outlook – Thrust of the Triangle
BEFORE
I have written clearly, “Potential targets for this setup are 2368 – 2395 – 2444.7+.”
AFTER
Do you remember the XAUUSD Wave Analysis?
Click Here: XAUUSD Outlook – Thrust of the Triangle
BEFORE
I have written clearly, “Potential targets for this setup are 2368 – 2395 – 2444+7.”
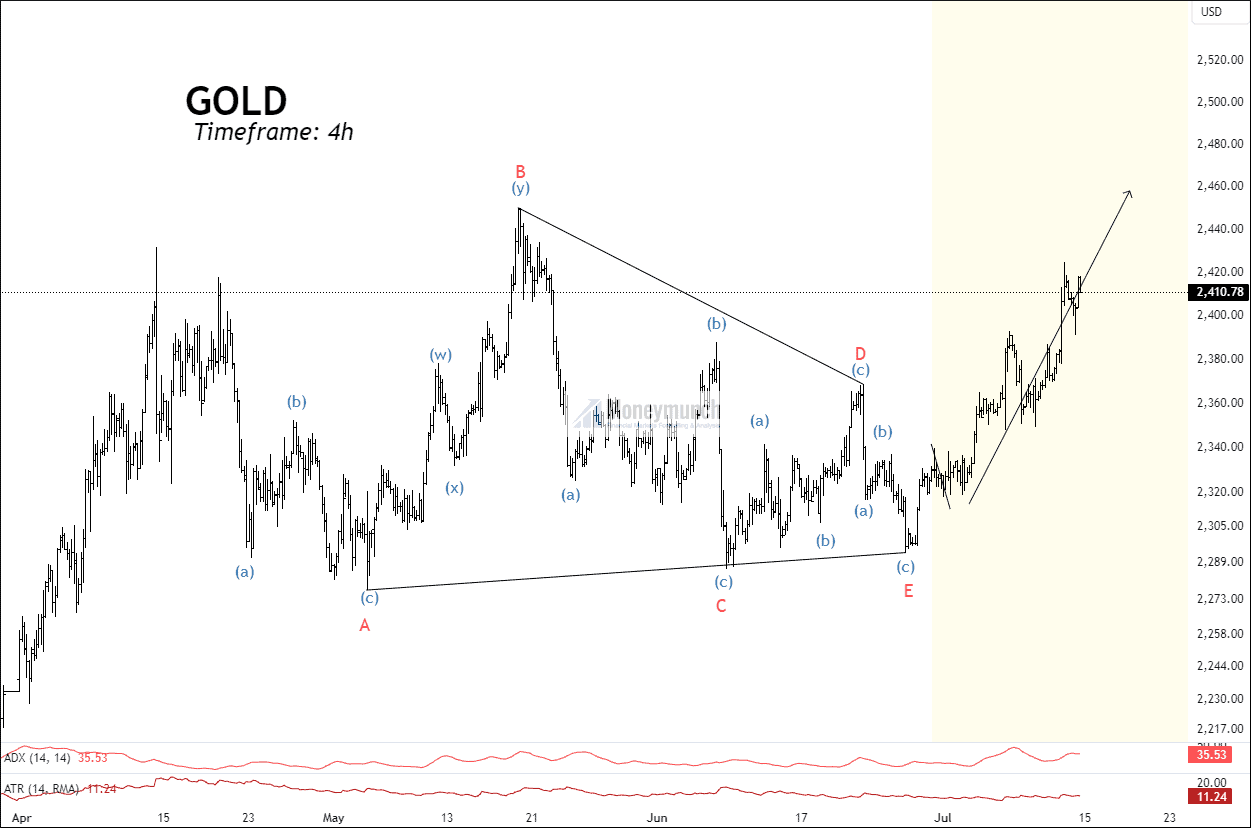 AFTER
AFTER
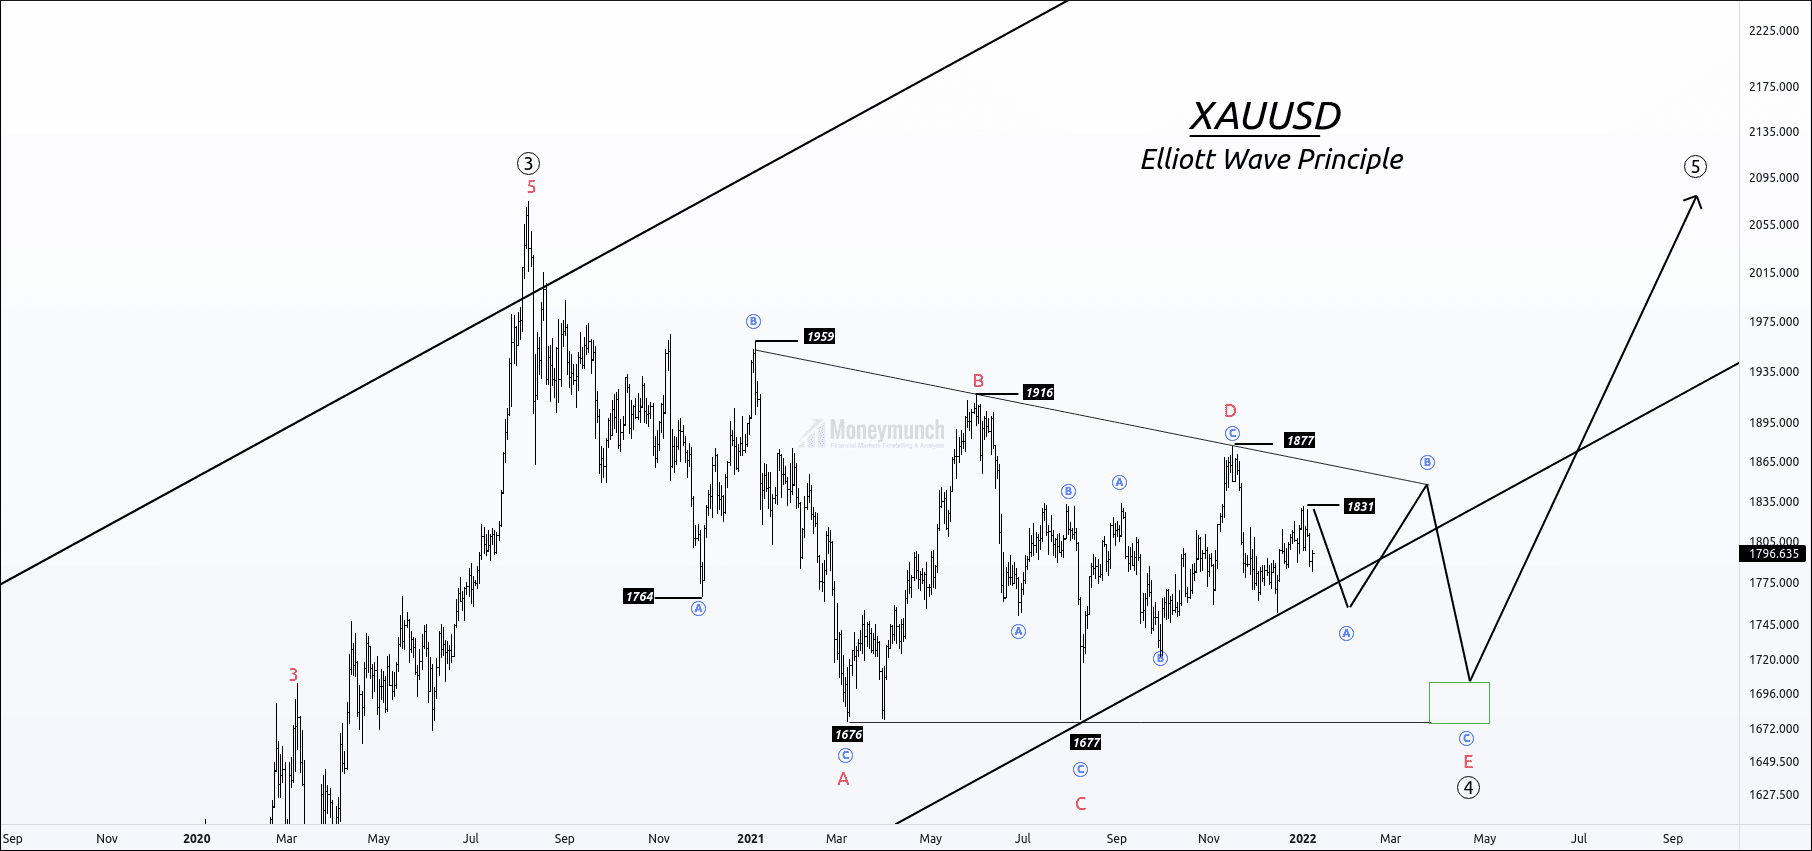
XAUUSD is forming a triangle on the wave ((4)).
This correction has taken more than 17 months, but the triangle is not over yet. Price has completed wave D of the 4th wave triangle, and wave E of wave A is in progress.
After completing the wave sub-wave A, the price will start wave B & then wave C.
The ending point of wave E is the starting point of the impulsive cycle.
Calculation of wave E:
Wave E can end 100% of wave sub-wave A at 1726.
Wave E can end near previous sub-wave B at 1719
Wave E can end at 100% of wave D at 1704.
Traders can wait for the breakout of the B-D trend line. Note that if the price doesn’t break the B-D channel, sideways will be continued.
To become a subscriber, subscribe to our free newsletter services. Our service is free for all.
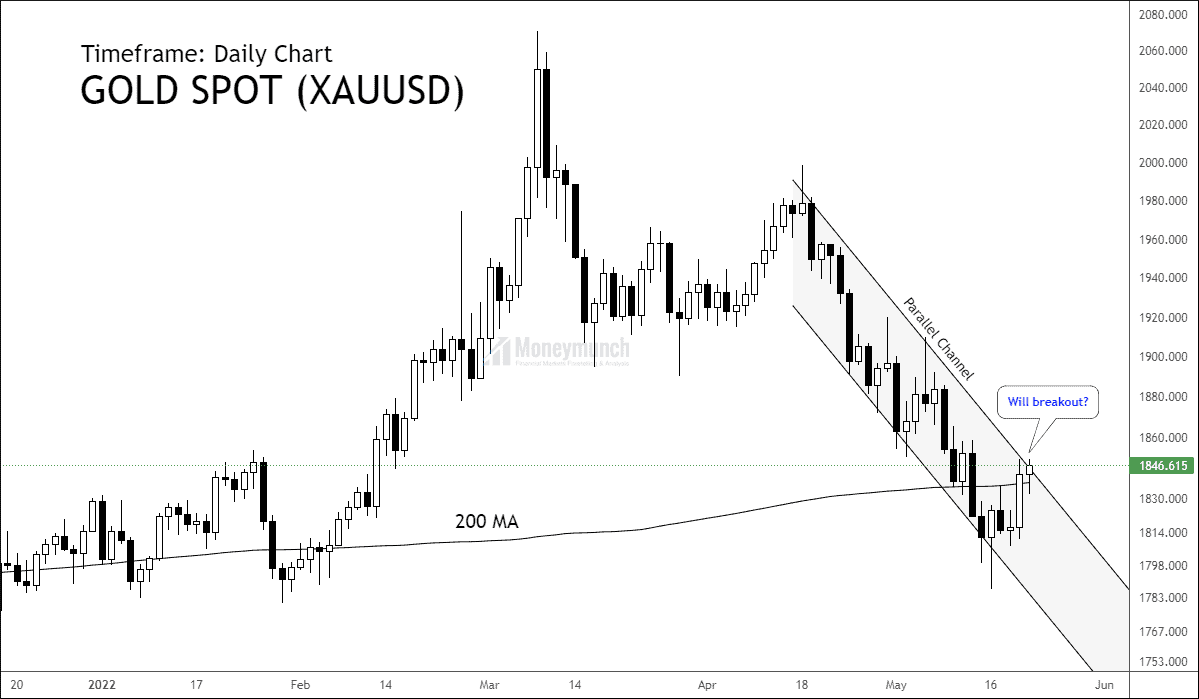
Click on the chart to enlarge
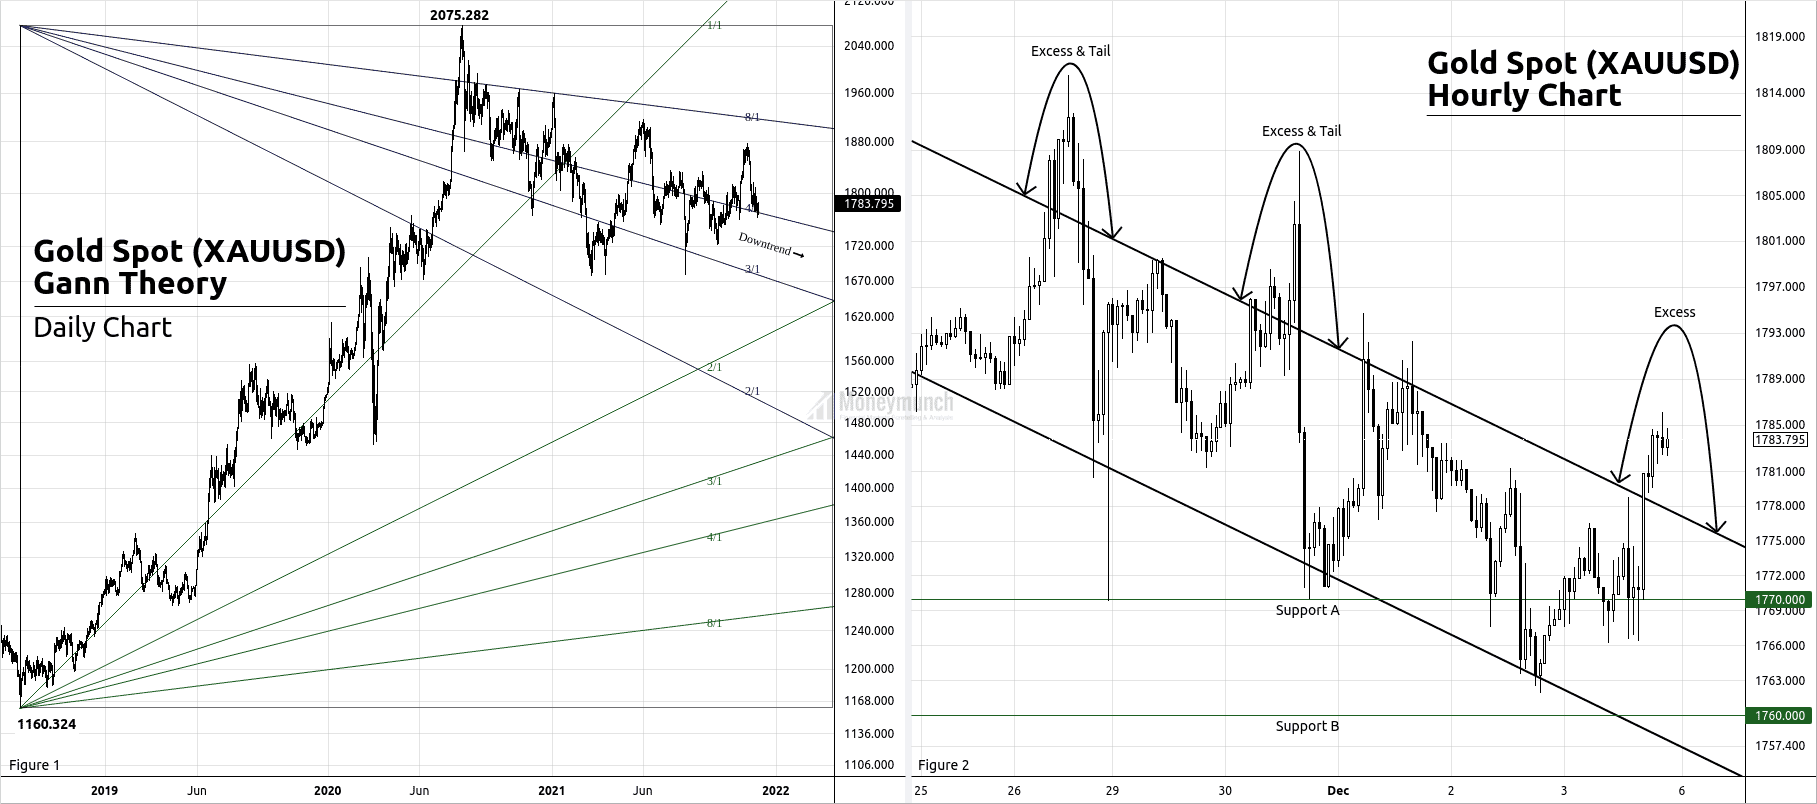
See the above chart wherein I have used the Gann Angles as support & resistance. As per the rules of All Angles, when the stock price breaks an Angle, it will rotate to the next Angle. Gold Spot is under a downtrend until the breakout of 8/1.
But that’s all about the long-term view. If you see the above Gold Spot’s hourly chart, there are two supports. And if XAUUSD repeats the game of excess & tail, then the downtrend will begin.
Hence, be ready for the levels of $1752 – $1726 – $1680 below.
Gold Spot can hold the downtrend by staying above 4/1. If it happens, then we will see $1830 – $1860 – $1900+ levels.
 Unlock This Article