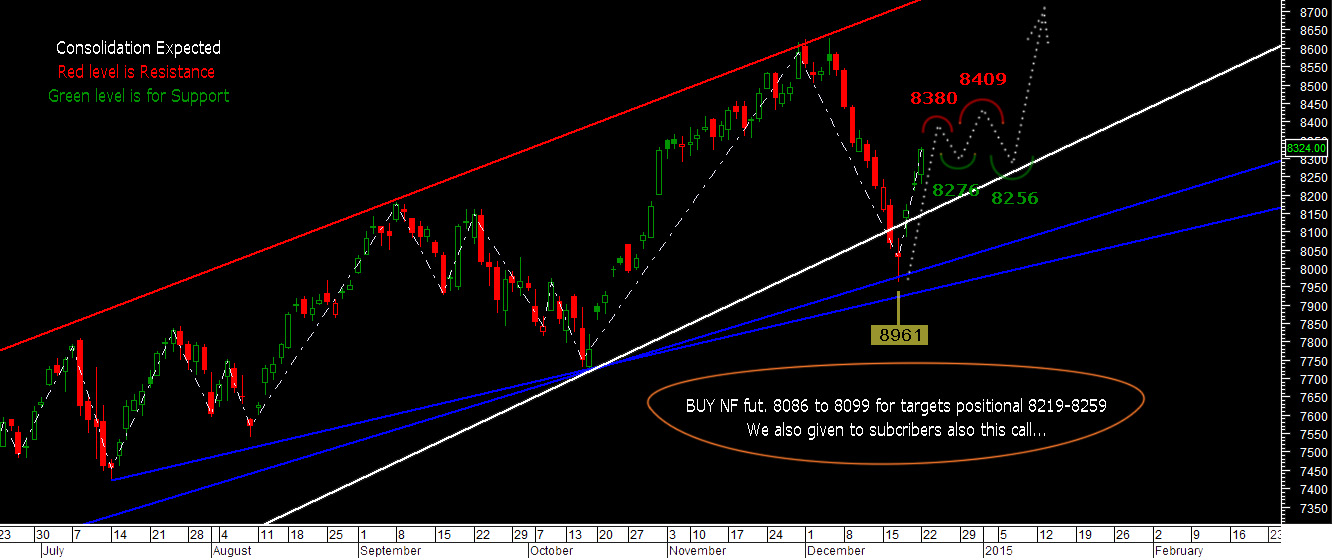
Looking for reliable and free nifty trading tips on Nifty Futures or Options, Bank Nifty Futures or Options, and Nifty Indices? Look no further than Moneymunch! We provide intraday and positional trading calls, technical analysis, research reports, and daily or weekly charts to help you make informed trading decisions in the stock market. Subscribe now and stay ahead of the game!
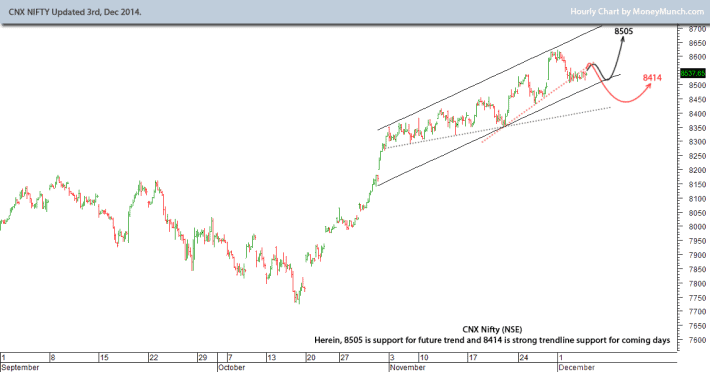
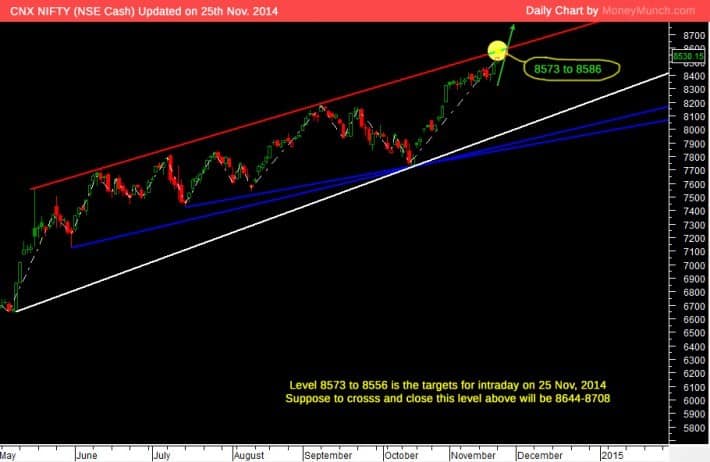
This is one chart of CNX Nifty analysis that defied the predictive/forecasting model. And as evidenced by the older Trend lines left ghosted in the chart. Prior analysis indicated that, this former support were defined in chart as, 8505 around. And if failure of nominal support, then next support 8414 around. We are going to buy nifty future near this 1st support of the CNX nifty technical analysis mentioned.
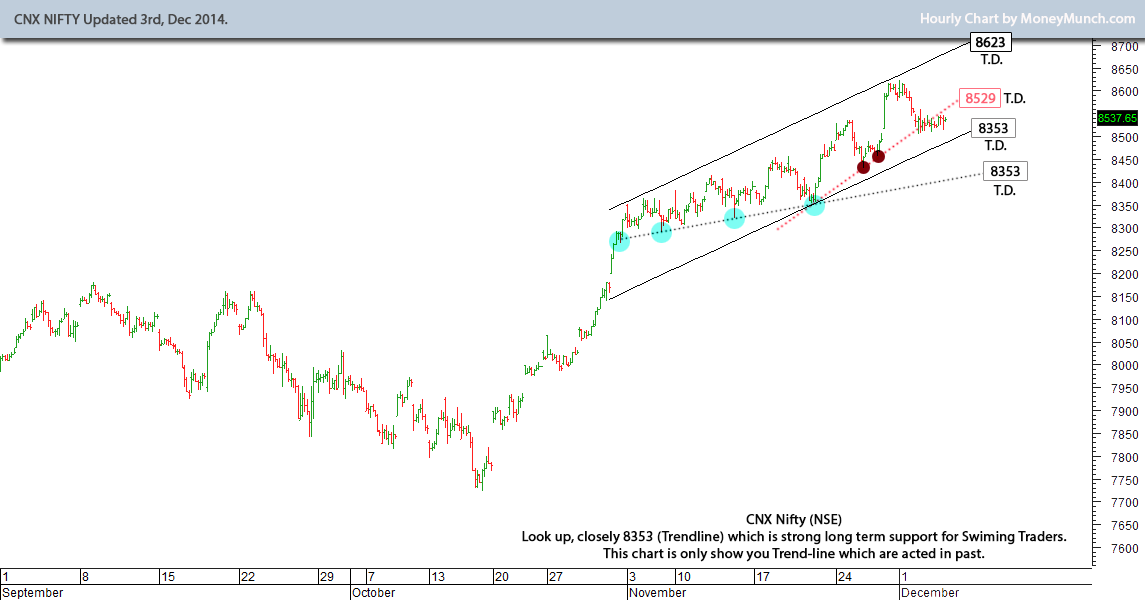
Let’s move CNX Nifty technical analysis for past trend lines :
Traders should look for past levels, which have acted as support and resistance in historical. In the CNX Nifty analysis chart, 8353 is long term support and 8529 failer support, but it’s also very import for acting as Resistance in the future.
I will update tomorrow for Subscribers where to buy Nifty future by the Yahoo Messenger.
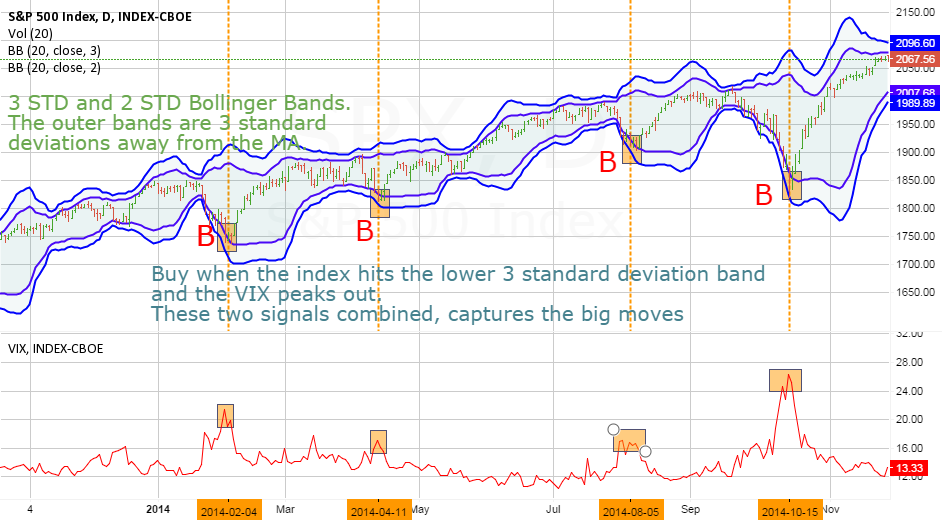
S&P 500 Index and compare with CNX Nifty technical analysis :
This is a setup for This is a setup for identifying buy signals in the market, particularly for S&P 500. The indicators we are using here are Bollinger Bands and the Volatility index, VIX. Overview: I have shown two bollinger bands with different settings – one with 2 Standard Deviations from the MA. And the other with 3 Standard deviations away from the MA. To get the buy signal. We will use the outer bollinger bands, which is the 3 standard deviations BB. THE SIGNAL: The buy signal is trigger when the S&P 500 index hits the lower band of the 3 SD bollinger band. And the VIX peaks. For VIX, there is no particular level it should cross. But a relatively high peak, compared to the previous mini-peaks, will be a good signal.
Source and more about CNX Nifty analysis and basic :
Nifty Future Dec. is declined to 8,597.50 and -27.75 down points (-0.32%) cause of RBI policy.
U.S. stock futures fell Monday and Asia markets diverged as investors returned in earnest from the Thanksgiving Day holiday.
Hong Kong’s Hang Seng Index plunged 2.6% as police used pepper spray and clubs against protesters demanding democratic reforms in the semi-autonomous Chinese territory.
In Tokyo, the Nikkei 225 index rose 0.8%. After markets closed there on Monday, Moody’s downgraded Japan’s sovereign debt.
In mainland China, a manufacturing survey showed activity weakened in November, adding to signs an economic slowdown is deepening. The Shanghai composite index traded flat.
Dow’s futures fell 0.5%, S&P 500 futures declined by a similar amount, and Nasdaq futures were down 0.3%.
European shares traded lower.
Wall Street stocks ended mostly lower Friday.
Today, early morning i have updated down Jones and nifty future charts with Profit Booking level 8617 and exactly Nifty future follow that level. for more reading about Nifty Future research: Nifty
To become a subscriber, subscribe to our free newsletter services. Our service is free for all.
The Dow’s parabolic move higher has continued with gusto throughout November. So what’s next? Well, I think Santa is coming to the party with a Christmas rally that will be the last hurrah for this bull market that began in 2009.
Let’s begin the analysis with the weekly chart.
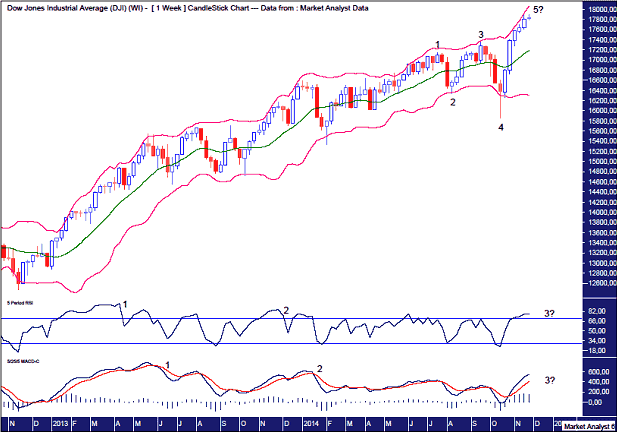
Dow Weekly Chart
The Bollinger Bands show price clinging to the upper band as expected for a parabolic move higher. This move up still looks to have more price and time left in it.
There has hardly been any pullback of significance in the last month, which is testament to the current strength of the bulls. I thought a minor 23.6% Fibonacci correction may occur, but the bears couldn’t even manage that.
So we have a 5 point broadening top in play as denoted by the numbers 1,2,3,4 and 5. We are now just awaiting the final wave 5 high to form.
This is also a “three strikes, and you’re out” topping pattern, which consists of three consecutive higher highs.
As outlined in the November newsletter, I expect this final high to be much higher than the point 3 high, as that high was only marginally higher than the first high at point 1. That appears to be holding true here.
There also appears the potential for the coming top to be accompanied by a triple bearish divergence in both the Relative Strength Indicator (RSI) and the Moving Average Convergence Divergence (MACD) indicator. This is denoted by the numbers 1, 2 and 3 on the respective lower indicators. This is commonly found at tops and generally leads to a significant decline.
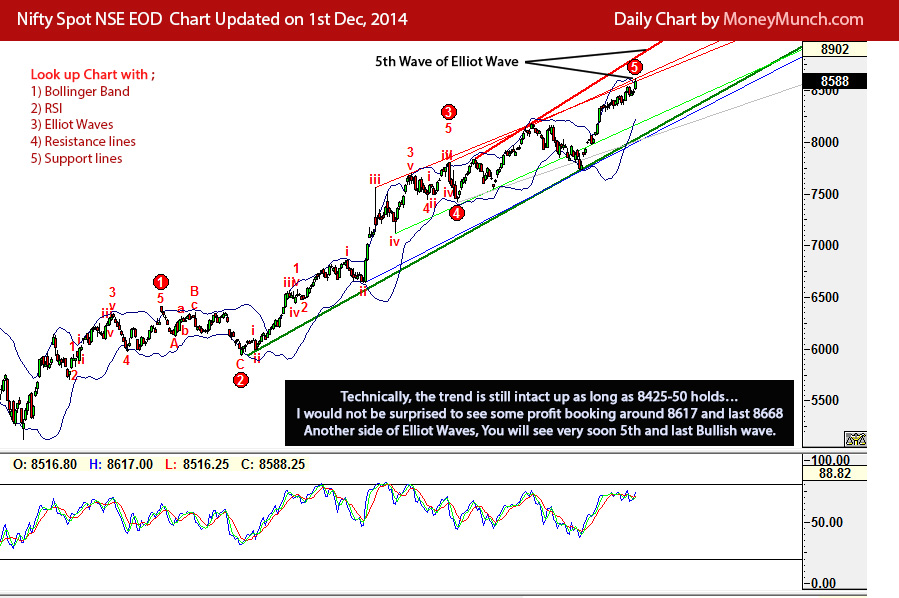
Let’s move on to the NIFTY Chart
As per my personal view, Nifty will fall heavy after big up move.
MORE DETAILS for NIFTY Future will be for Subscribers live by the Yahoo Messenger.
To become a subscriber, subscribe to our free newsletter services. Our service is free for all.
Last Nifty future call by us is to buy 8455 for targets 8610 (Achieved Targets).
Look Up FREE CNX Nifty chart and watch 8575 above to Cash Nifty.
We have bought Nifty Future 8451 to 8466 and also SEND you Email of This call: BUY NF 8449 to 8466 wtih Stoploss 8432 for targets 8572 to 8589
MORE DETAIL WILL BE FOR SUBSCRIBERS ONLY.
FII money:Mint newspaper says today that FII inflows into equity and debt in 2014 will top $40 billion – the highest ever. Of this, the greater proportion (60 percent) has gone into debt. Will these flows suddenly cease or reduce?
Political stability, reforms and business climate.
Inflation trajectory.
The RBI’s stellar act.
MORE About CNX NIFTY:
The CNX Nifty is a well diversified 50 stock indices, accounting for 23 sectors of the economy. It is used for a variety of purposes such as benchmarking fund portfolios, index based derivatives and index funds.
CNX Nifty is owned and managed by India Index Services and Products Ltd. (IISL). IISL is India’s first specialism company focused upon the index as a core product. CNX Nifty has shaped up as the largest single financial product in India, with an ecosystem comprising: exchange traded funds (onshore and offshore), exchange-traded futures and options, other index funds and OTC derivatives (mostly offshore).
Reference Source:
Basics and definition of CNX NIFTY Tips on official site of NSE india.
The CNX Nifty covers 22 sectors of the Indian economy and offers investment managers exposure to the Indian market in one portfolio with Compressive about CNX Nifty.
You can do Technical analysis and Research on Free CNX Nifty Tips with Live Rate and chart.
To become a subscriber, subscribe to our free newsletter services. Our service is free for all.