The upcoming market moves will destroy 80% of traders’ investments. We are sharing with you NSE’s perspective that will be helpful in January 2022.
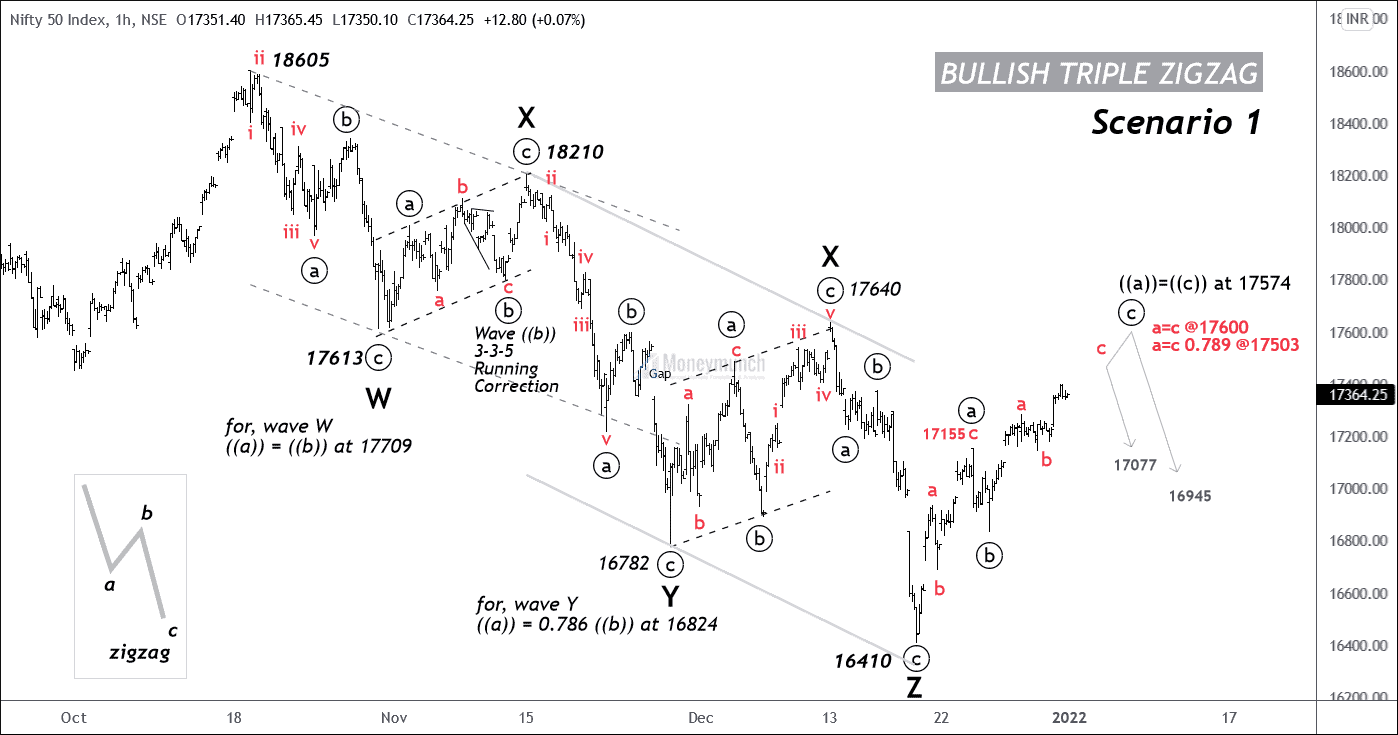
NIFTY: Bullish Triple Zigzag (1H)
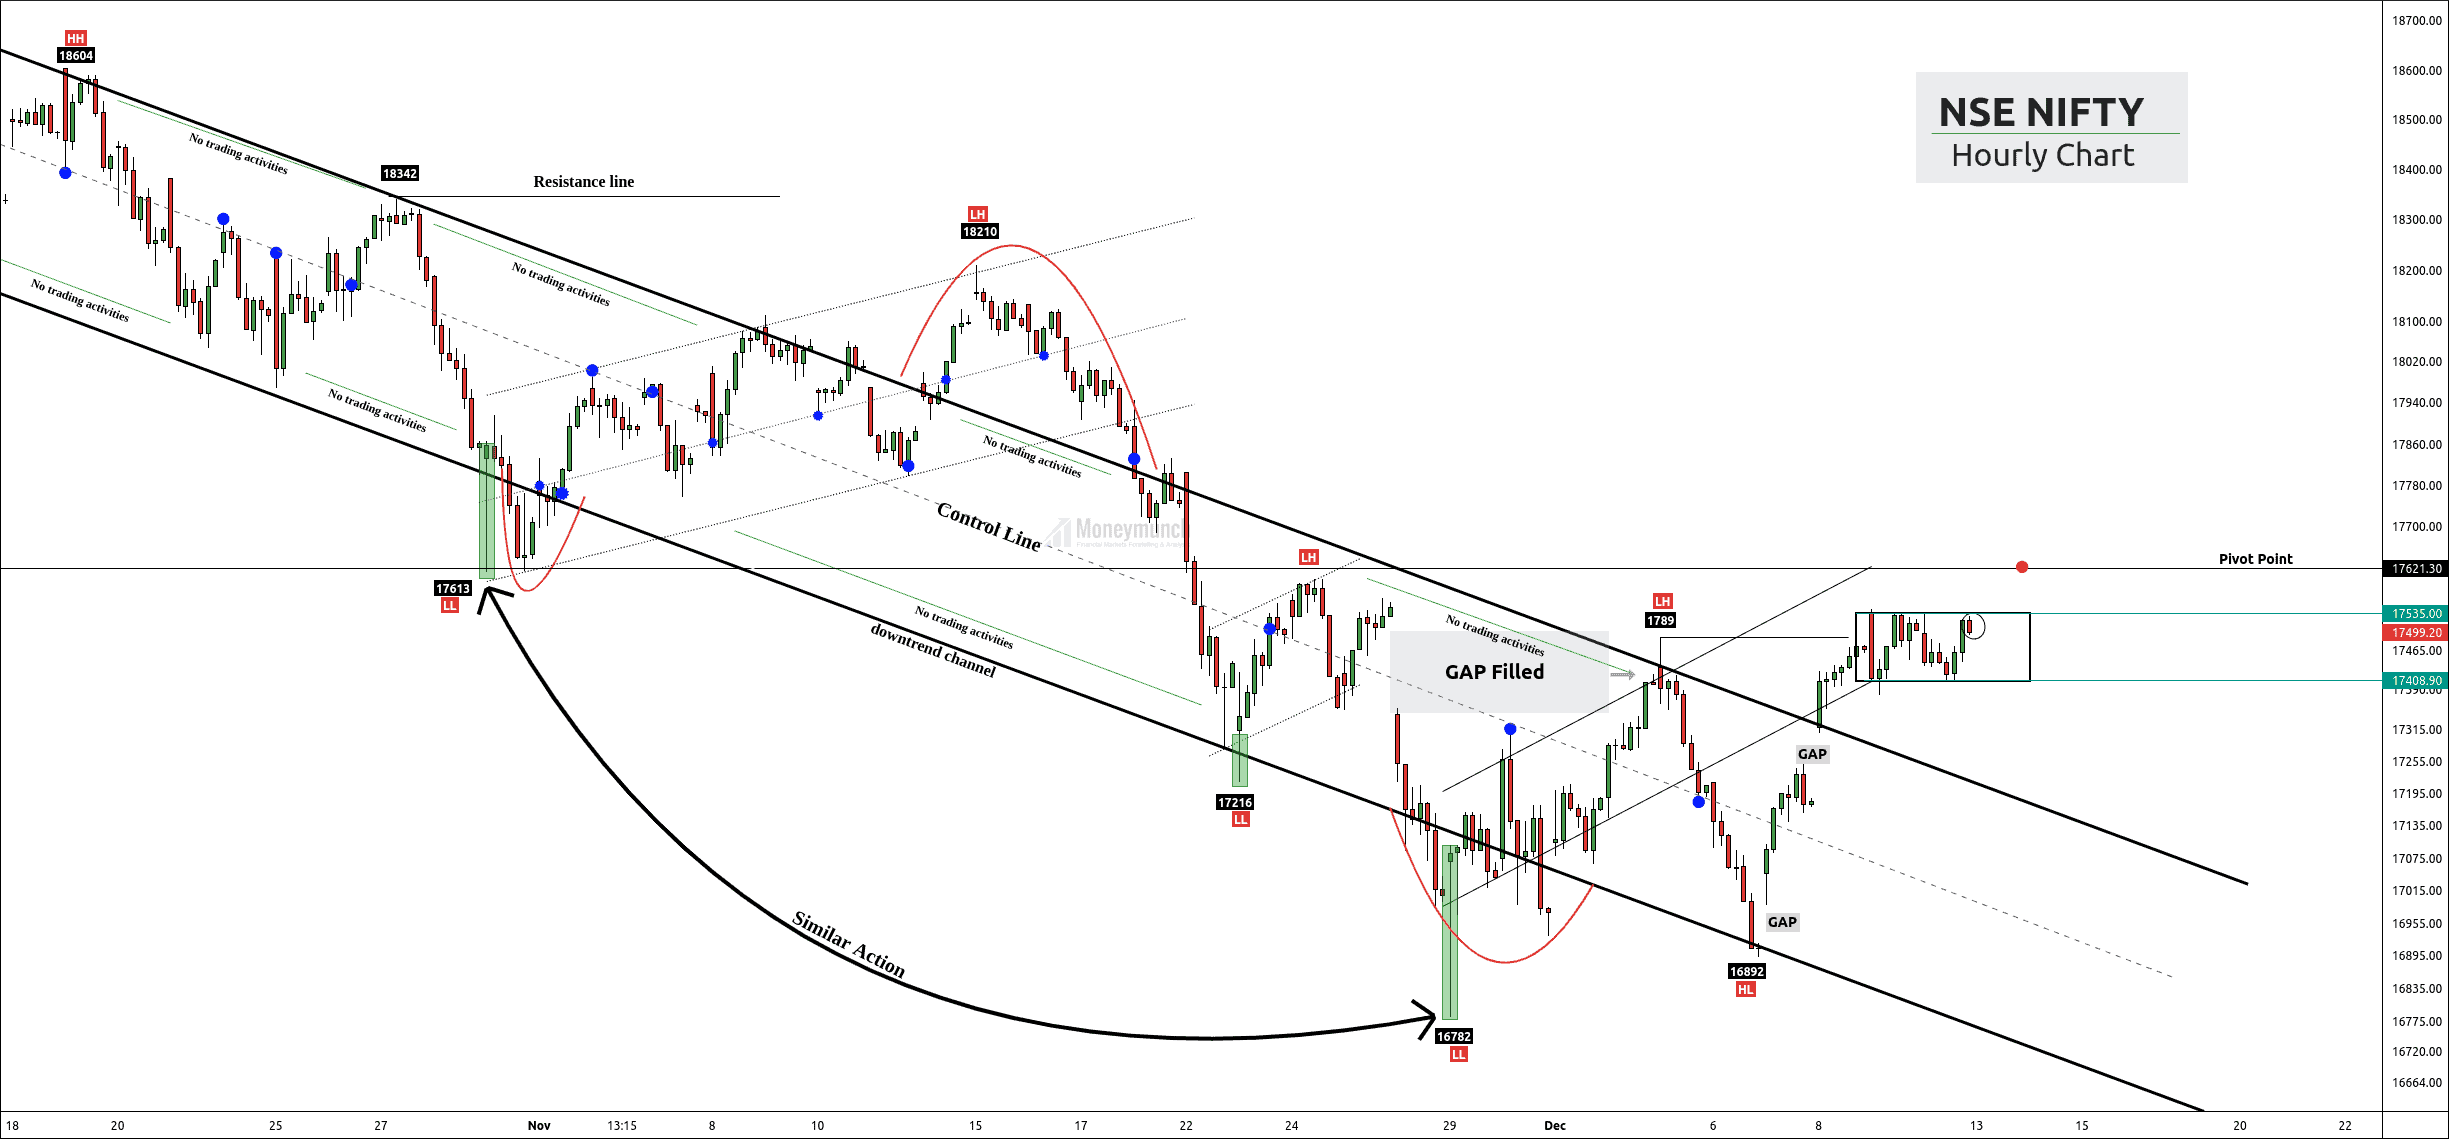
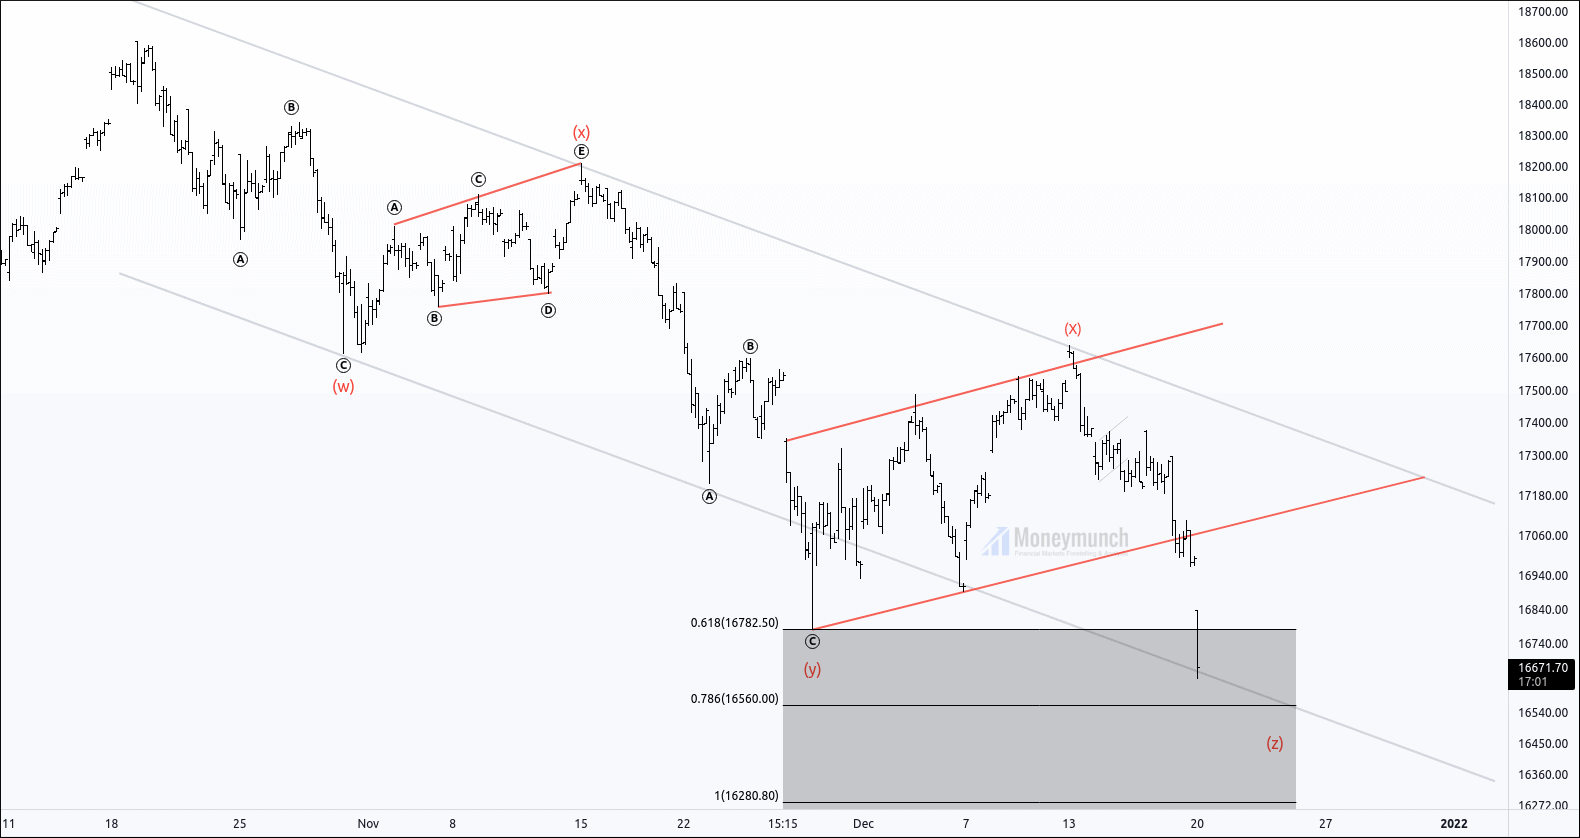
The spot nifty hourly chart at an exciting juncture. The juncture isn’t easy to identify the next turn for beginners. Where will upturn sustain?
Below levels are very crucial. That will help you make a new position or create a trade setup on Nifty.
The first observation should be on the trend. And it is down by looking at the above chart (left to right). The price is defining a lower low. And that is W, Y, and Z. Moreover, the low high is similar (1X and 2X). Hence, I have chosen Oct 18605 high and Dec 16410 low. Wherein come out Bullish Triple Zigzag corrective pattern formation.
Are you expecting a continuous downtrend? Then look at the equality ratio. That gives you resistance levels. And after the ending of the point of the Z wave, ((w))=((y)) at 17574.
Furthermore, the level of 17600 is equal to waves A and C, but the 17503 level is the first upcoming resistance A = C | 0.789 ratio.
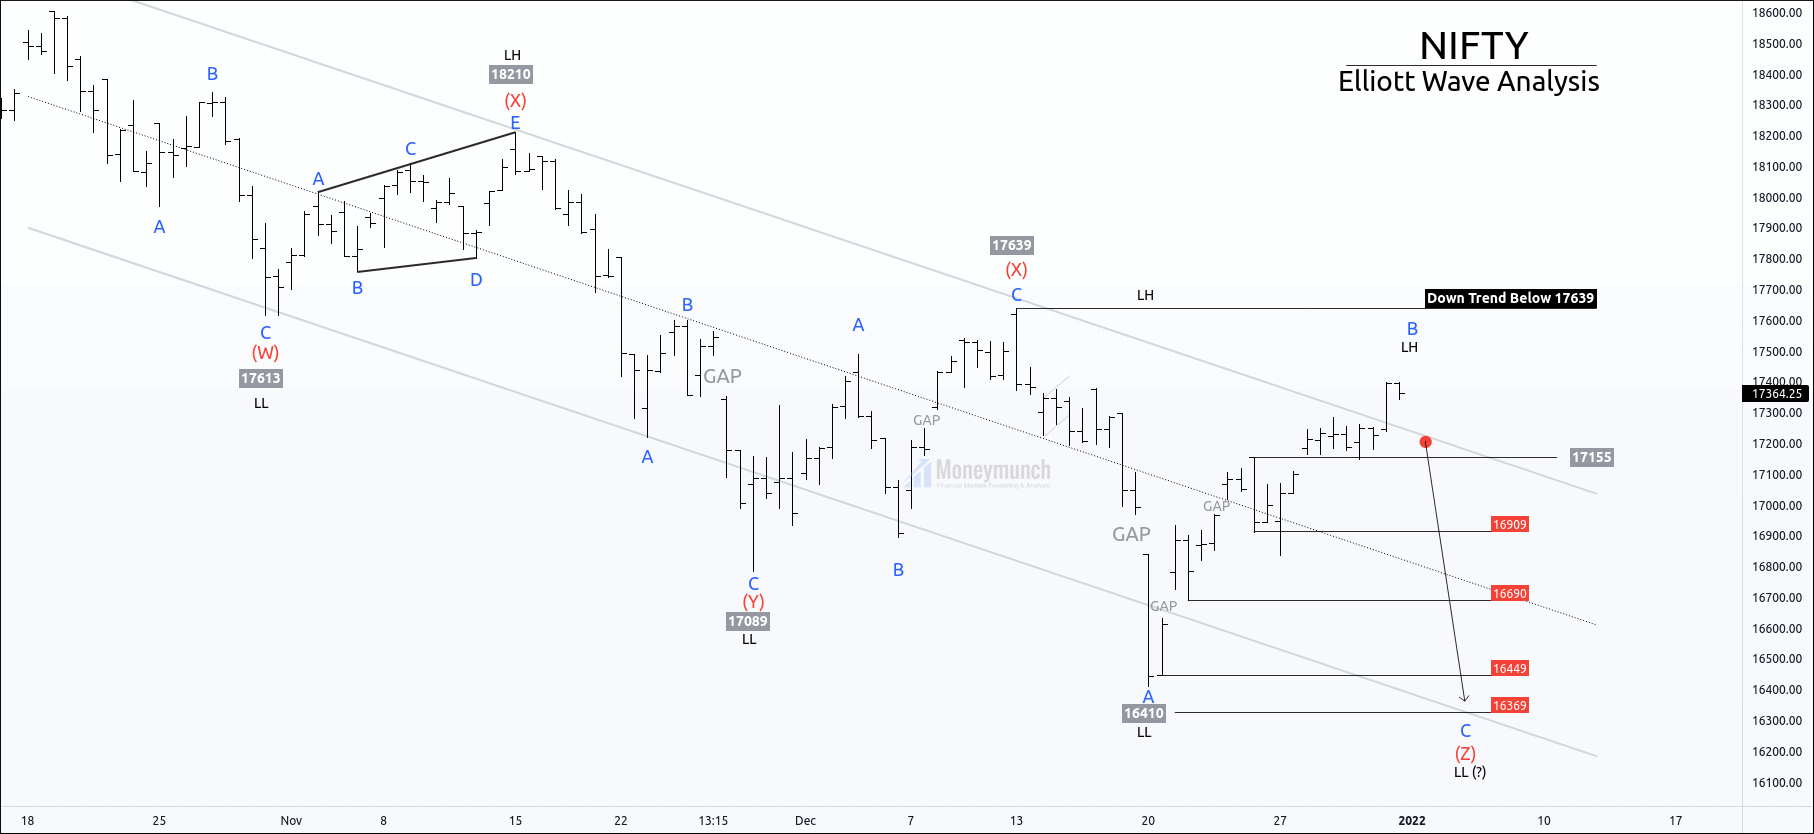
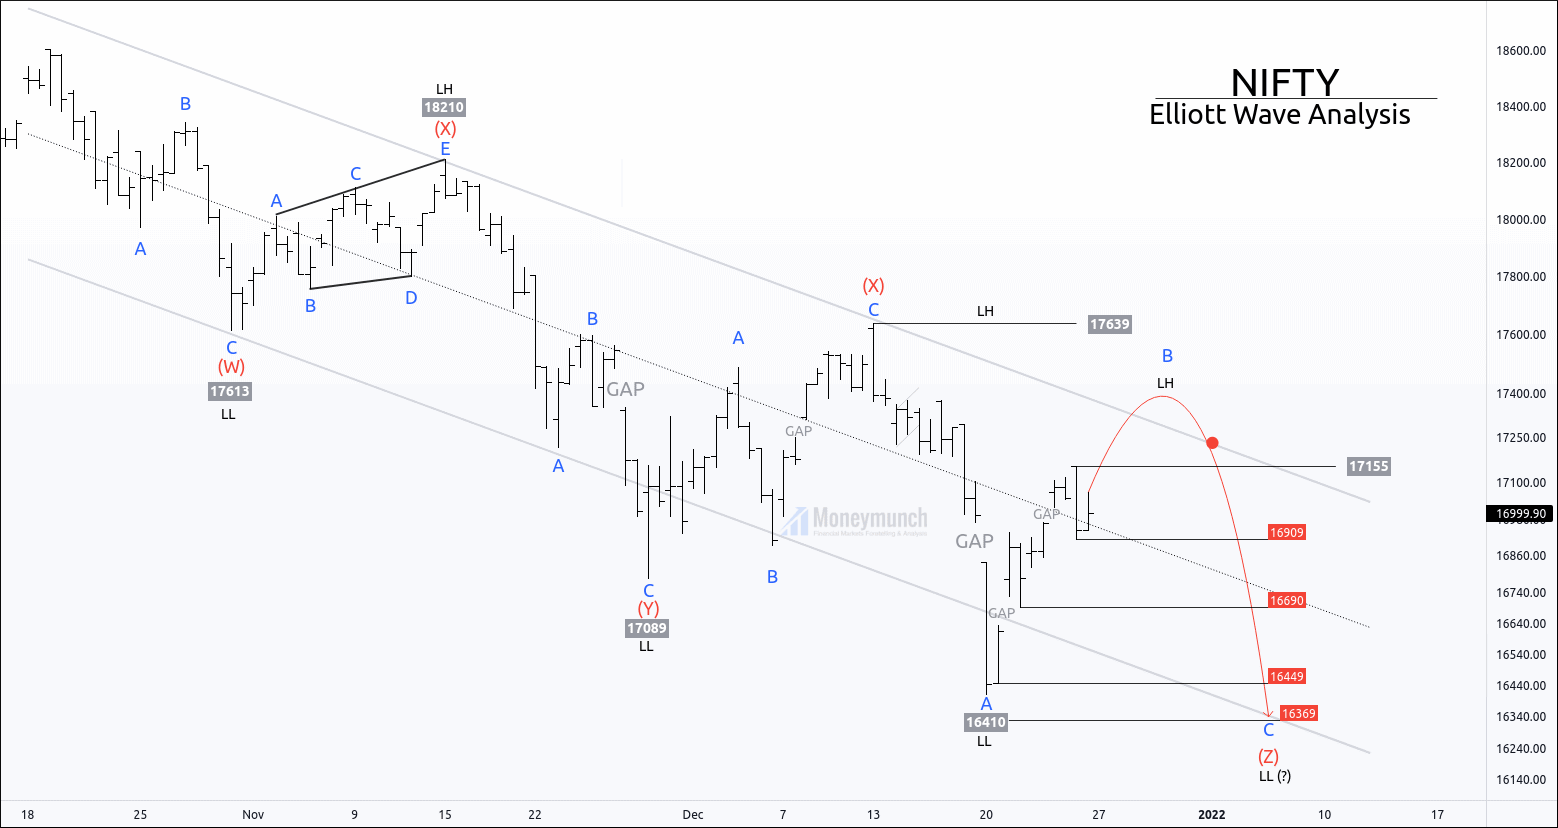
Trend Reversal Key Level:
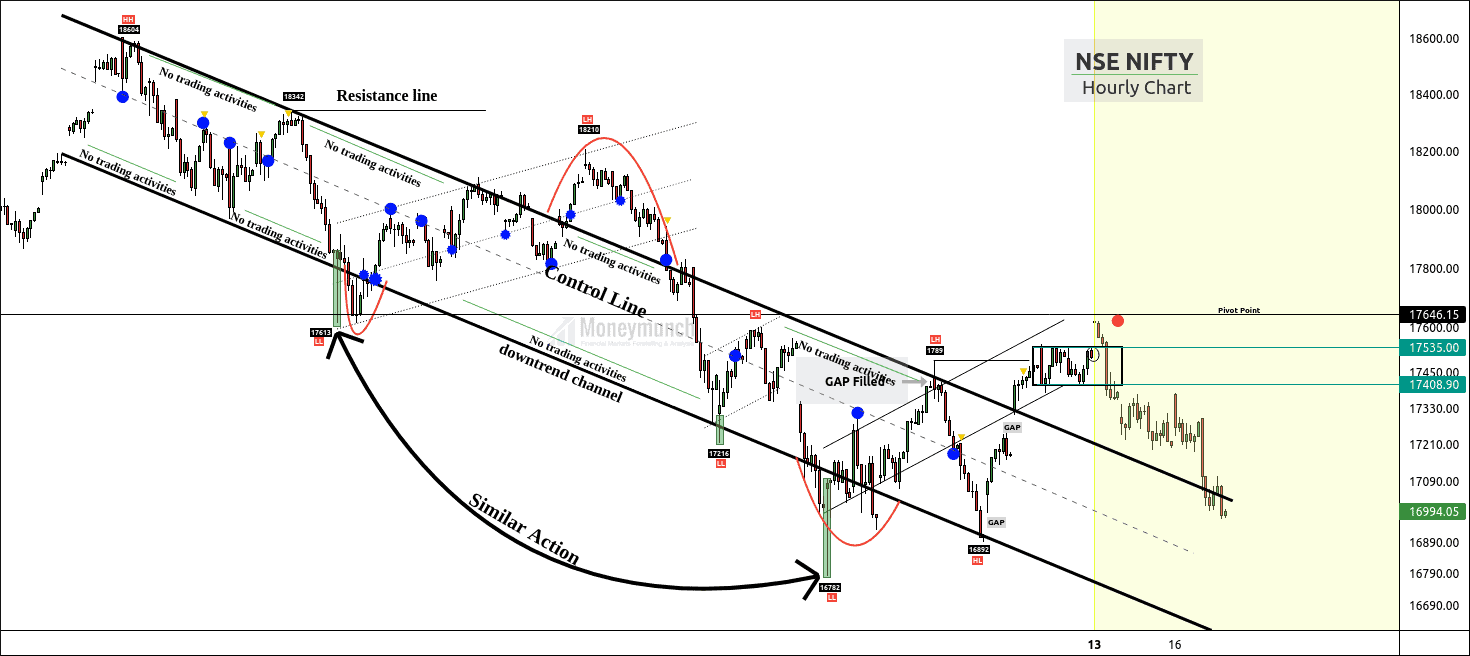
Reconsider the wave count at 17640 lower high.
According to the current market situation, the Nifty price is under 17640. It’s a direct sign of downtrend moves. And the first target will be the 17077 level.
Nifty traders must look at this DJIA chart.
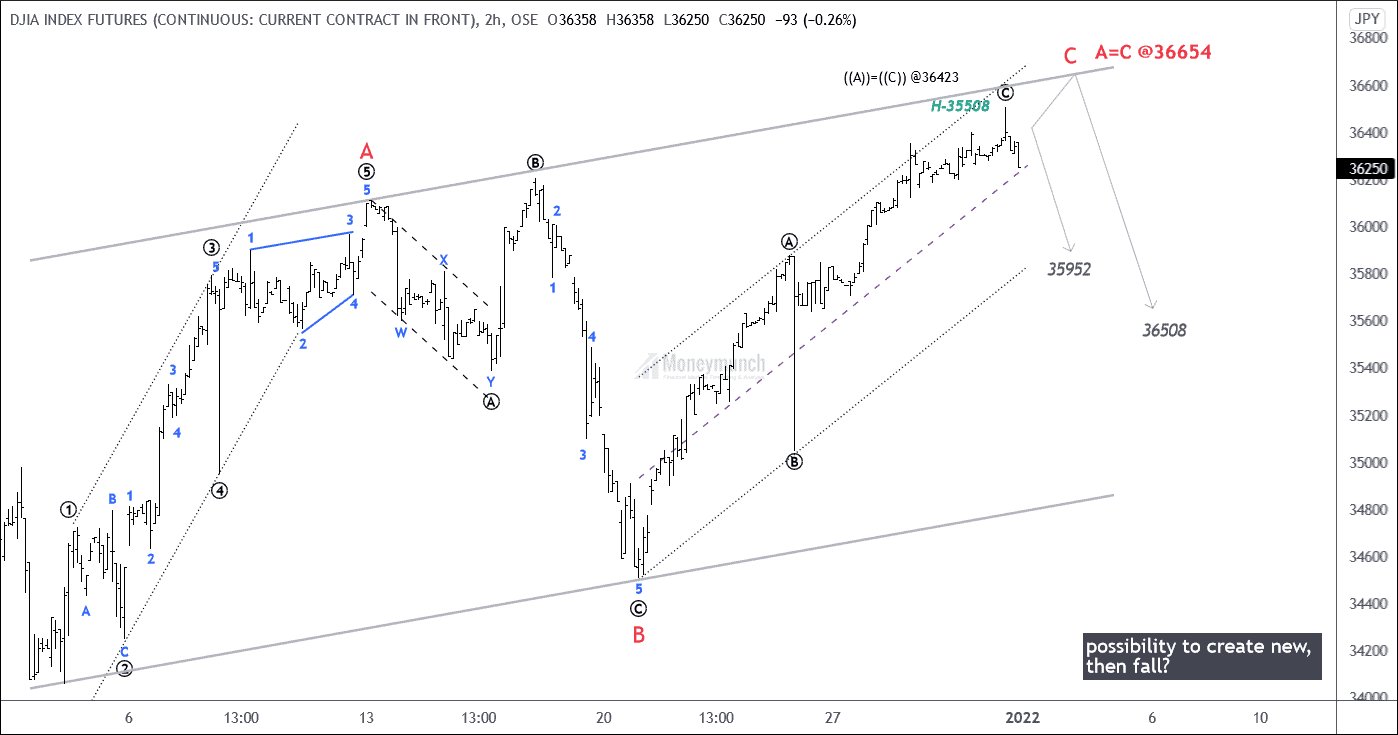
Can you see the new high on DJIA? Further information I will update you soon.To become a subscriber, subscribe to our free newsletter services. Our service is free for all.
 Unlock This Article