NSE BANKNIFTY & FINNIFTY – Elliott Wave Projection

Timeframe: Daily

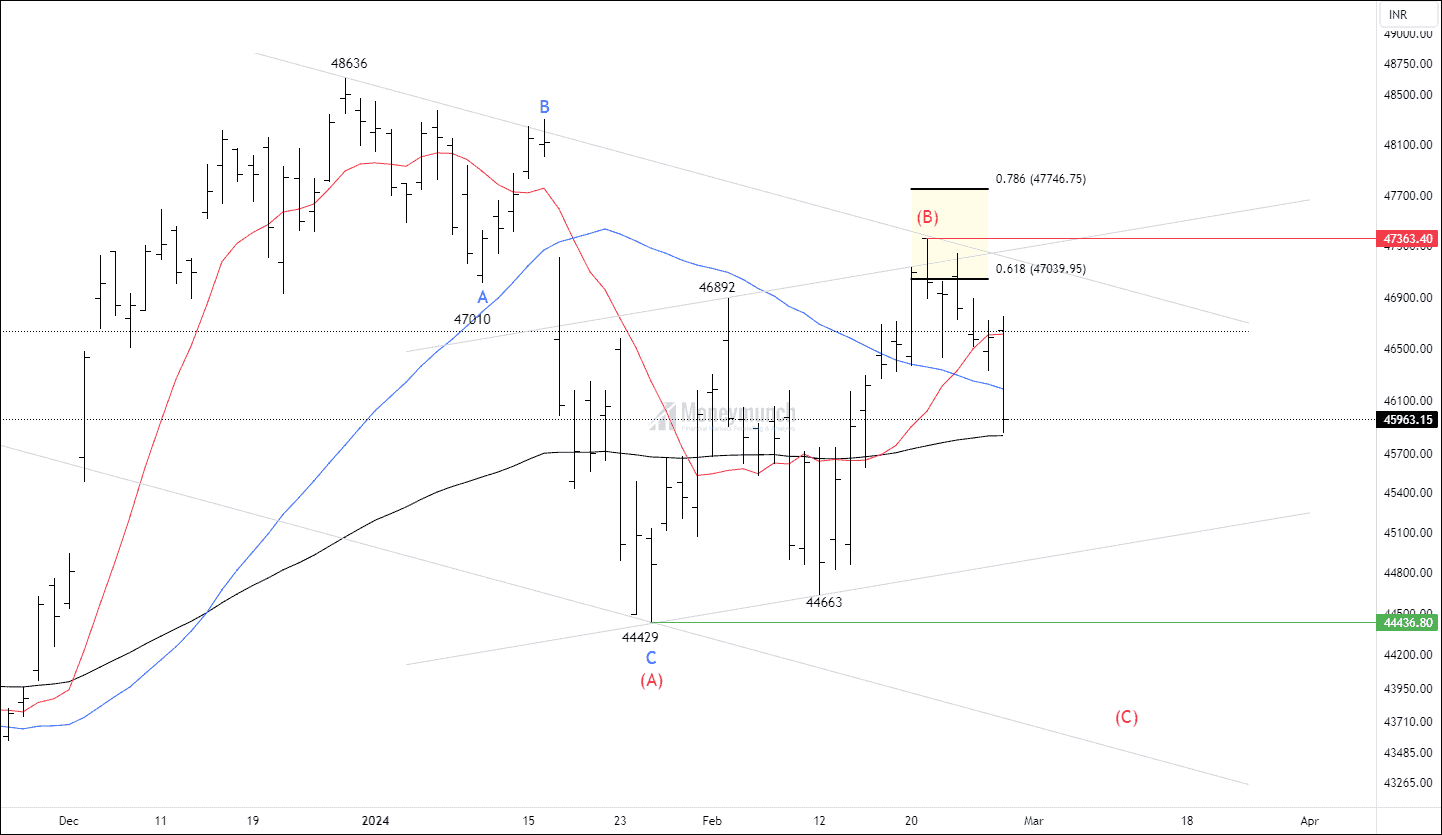
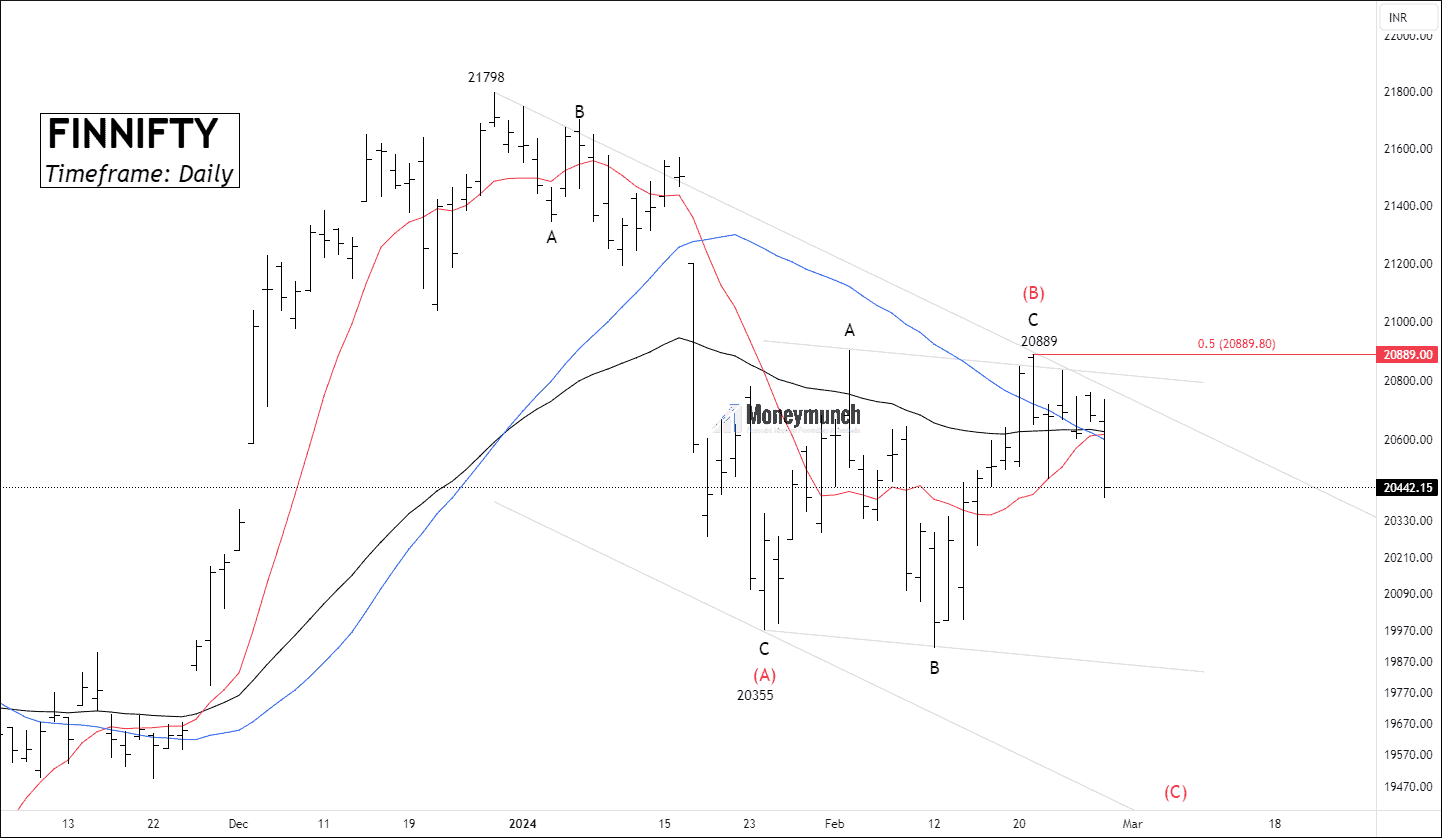
The bank nifty spot has broken down 10/35/50 Moving average and trading at 100 Exponential moving average that spots weakness. From the low of 44429 to the high of 47363, the ADX of the price fell to 15.92.

According to Elliott Wave, the current structure can be labeled A-B-C correction. It’s acceptable to expect a flat as wave B retraced 78.6%.

Alert bulls! There are only two opportunities:
(1) At the lower band after completion of wave C.
(2) Only after the breakout of wave (B).

Wave C can occur near wave the low of (C). sellers can extend targets after the aggressive breakdown of wave C. If the price is falling and reaching too far from the breakdown place, the move can be reliable as an impulsive.

Trade setup with entry, exit, and invalidation is only available for premium subscribers.
Free nse finnifty chart callsContinue reading

LuxmaTech: NSE’s Bear-Slaying Titan

Do you remember the NSE LUMAXTECH Wave setup?
Click here: NSE LUMAXTECH – Elliott Wave Count

Free nse lumaxtech chart callsBEFORE

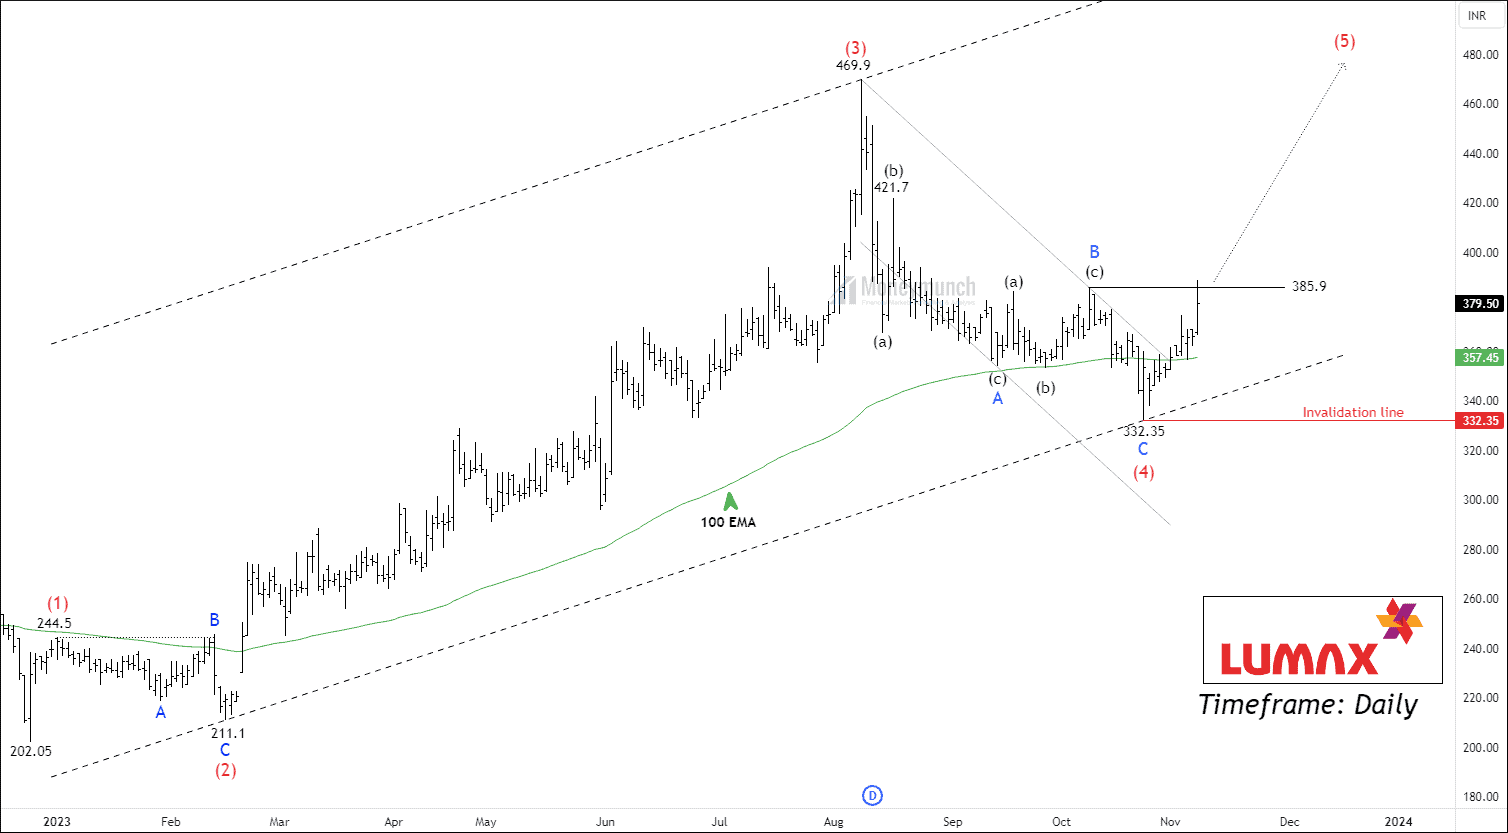
We had written clearly, “Should the price surpass the wave B level at 385.9, traders may consider taking positions with the following price targets: 405 – 421 – 448+”

NSE LUMAXTECH chart callsAFTER

Timeline:

[1 February 2024]

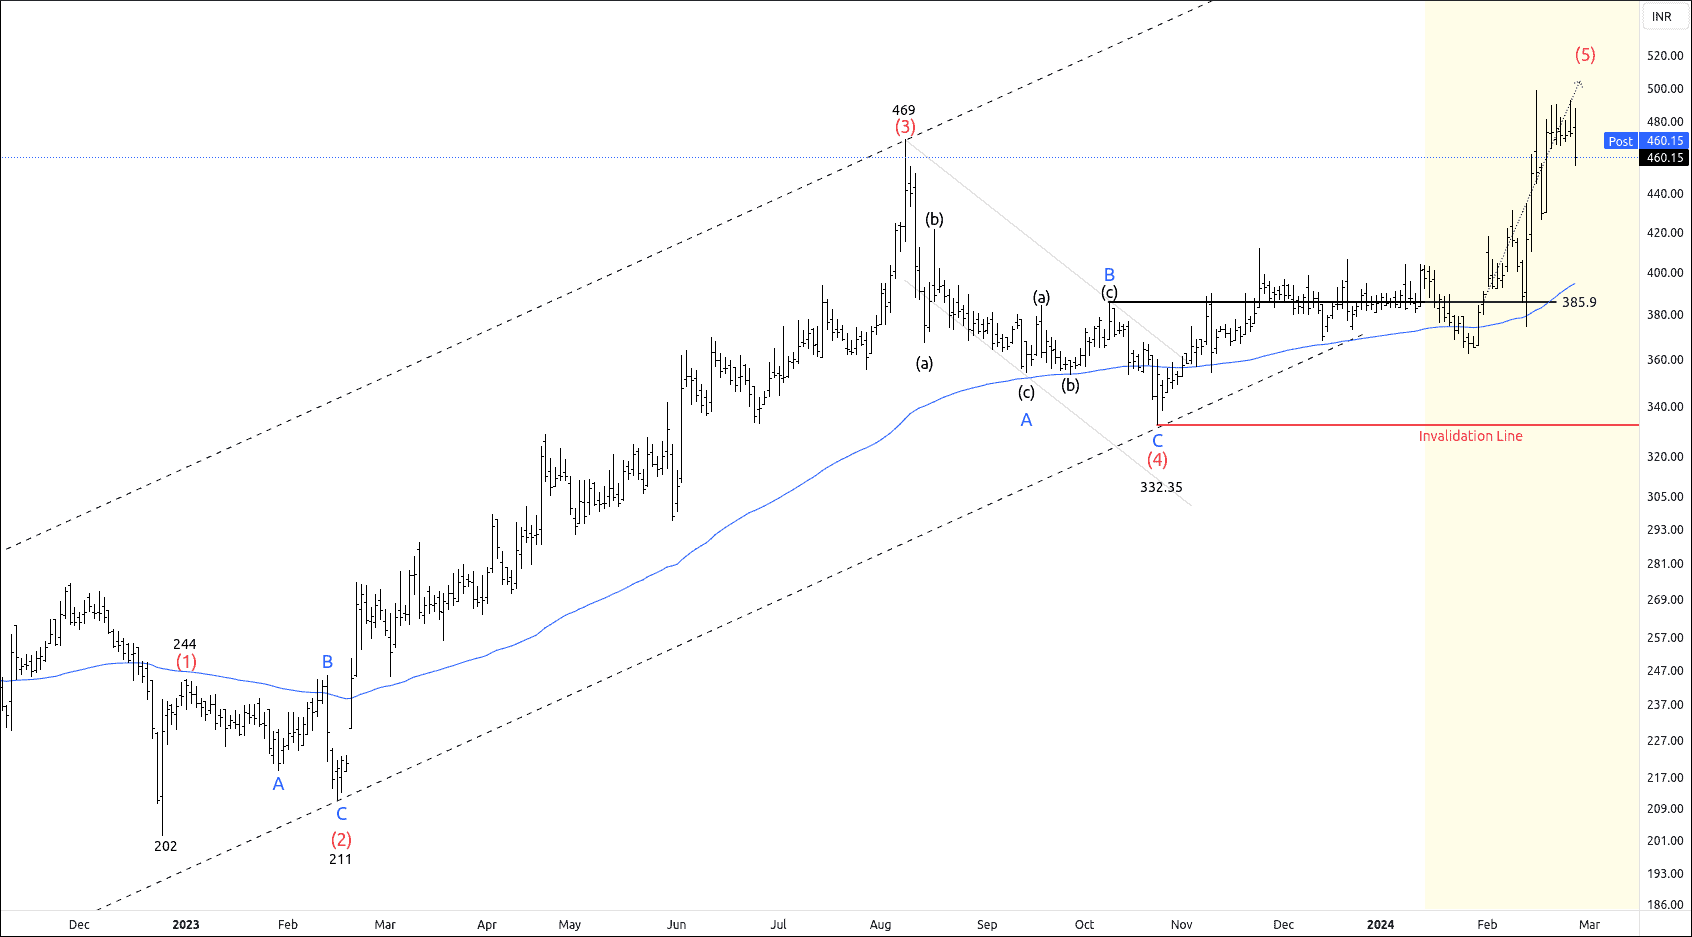
  • 09:15 AM – Price touched the first target of 405, and made a new high of 418.

[08 February 2024]

  • 09:30 AM – LUMAXTECH hit the second target of 421, and made a new high of 431.

[14 February 2024]

  • 12:30 PM – Price achieved the final target of 448.

[15 February 2024]

  • 10:15 AM – NSE LUMAXTECH made a new high of 498.

This Setup could generate returns exceeding 28% in just one month.Continue reading

NSE TREGA Witnesses Bullish Run with a 42% Surge

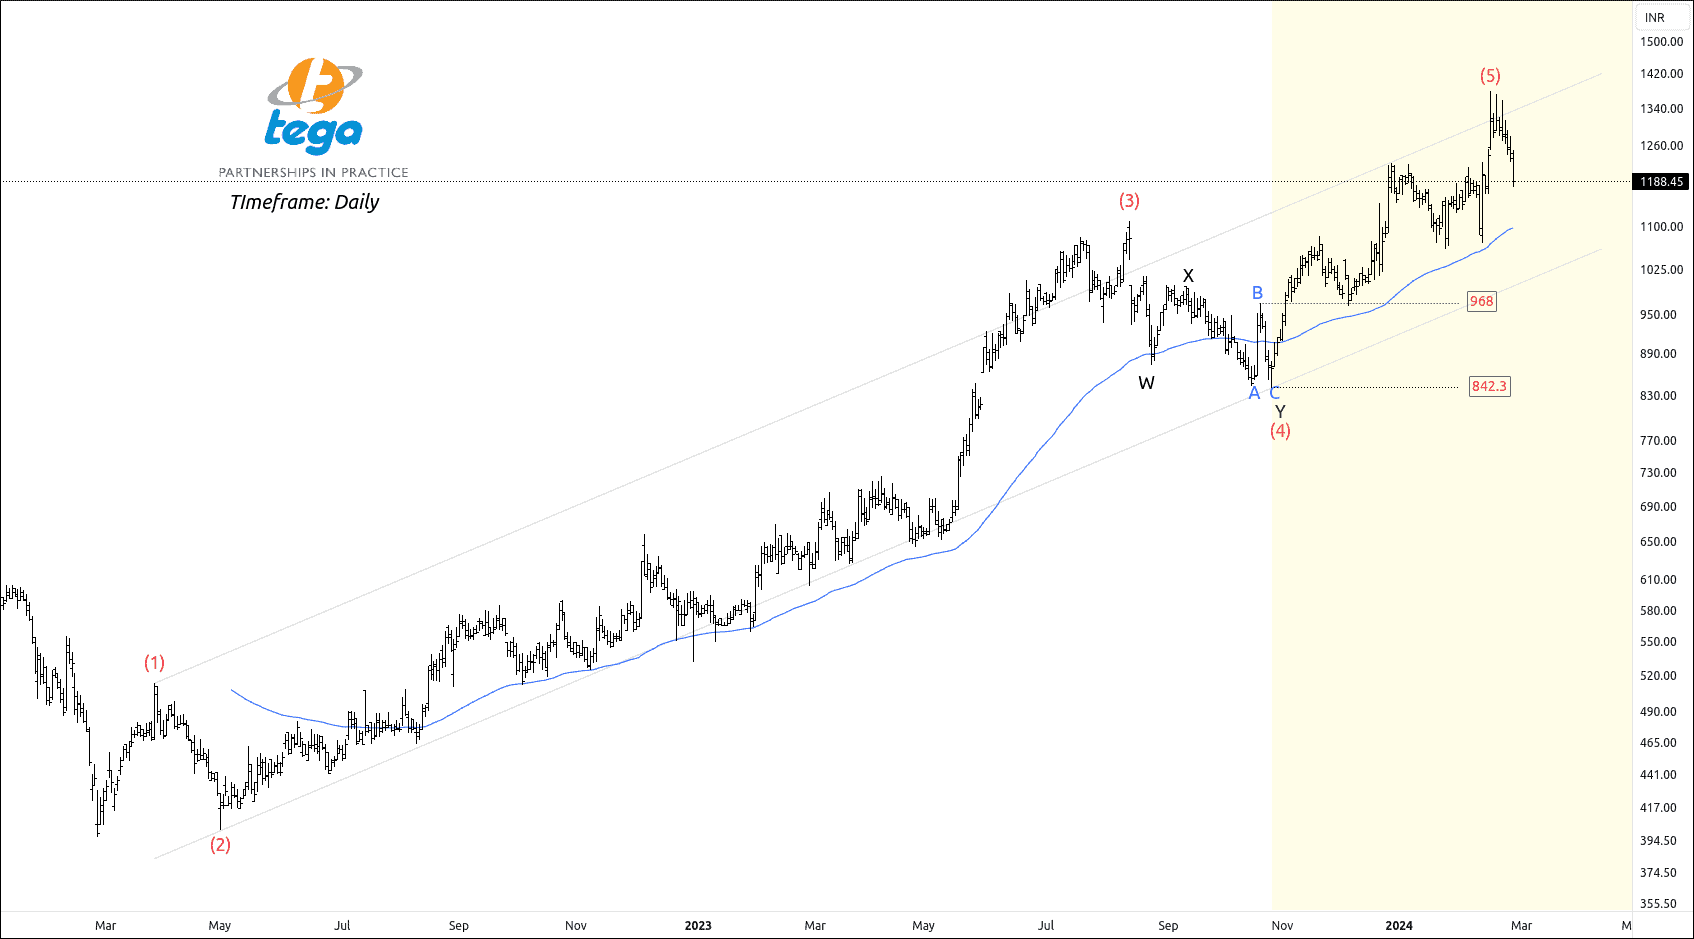
Do you remember the NSE TEGA Wave setup?
Click here: NSE TEGA – Elliott Wave Projection

Free nse tega chart callsBEFORE

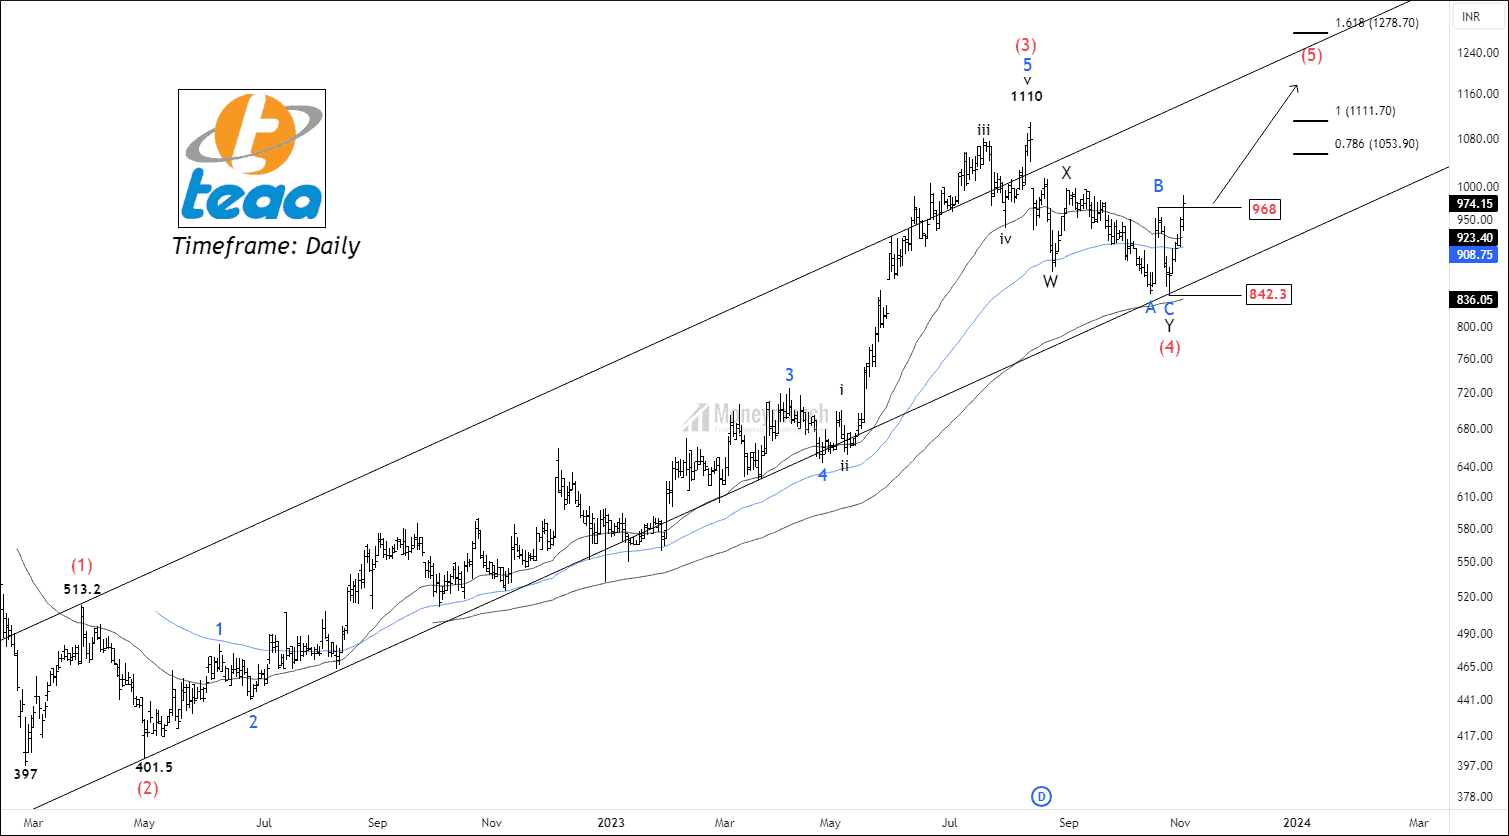
We had written clearly, “If price wave Wave B at  968, traders can buy for the following targets: 1055 – 1171 – 1270+”

Free NSE TEGA chart callsAFTER

Timeline:

[15 November 2023]

  • 09:15 AM – Price touched the first target of 1055.

[26 December 2023]

  • 11:00 AM – NSE TEGA hit the second target of 1171.

[15 February 2024]

  • 09:15 AM – Price achieved the final target of 1270, and made a new high of 1380.

This Setup could generate returns exceeding 42% in just 15 weeks.Continue reading

NSE VOLTAS – Buyers Crushed the Sellers

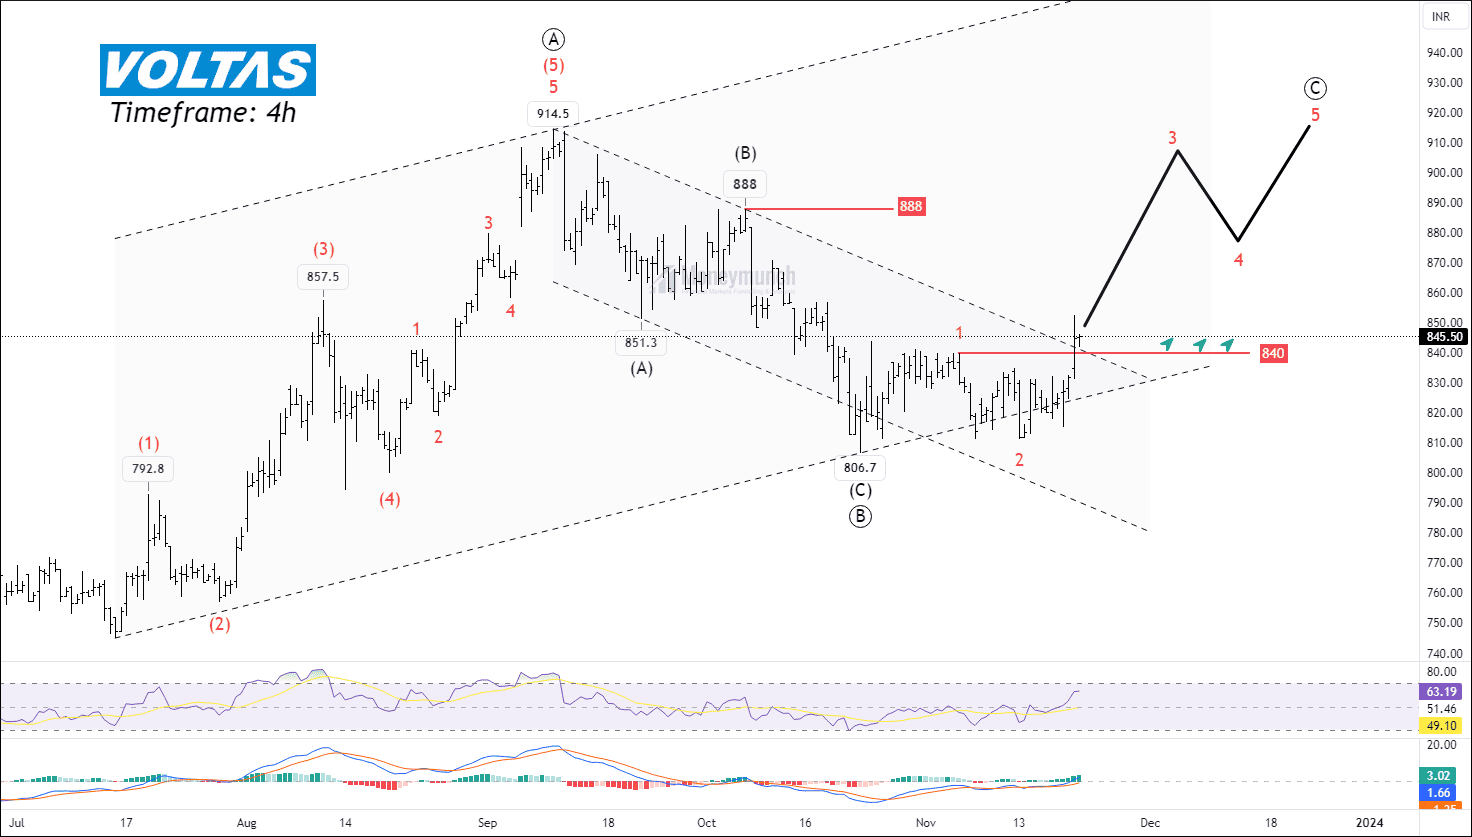
Did you trade remember NSE VOLTAS Wave setup?
Click here: NSE VOLTAS Is Getting Ready For The Last Move (C)

Free nse voltas chart callsBEFORE

We had written clearly, “Should the price maintain levels above 840, traders may consider buying with the following targets: 860 – 880 – 904+”

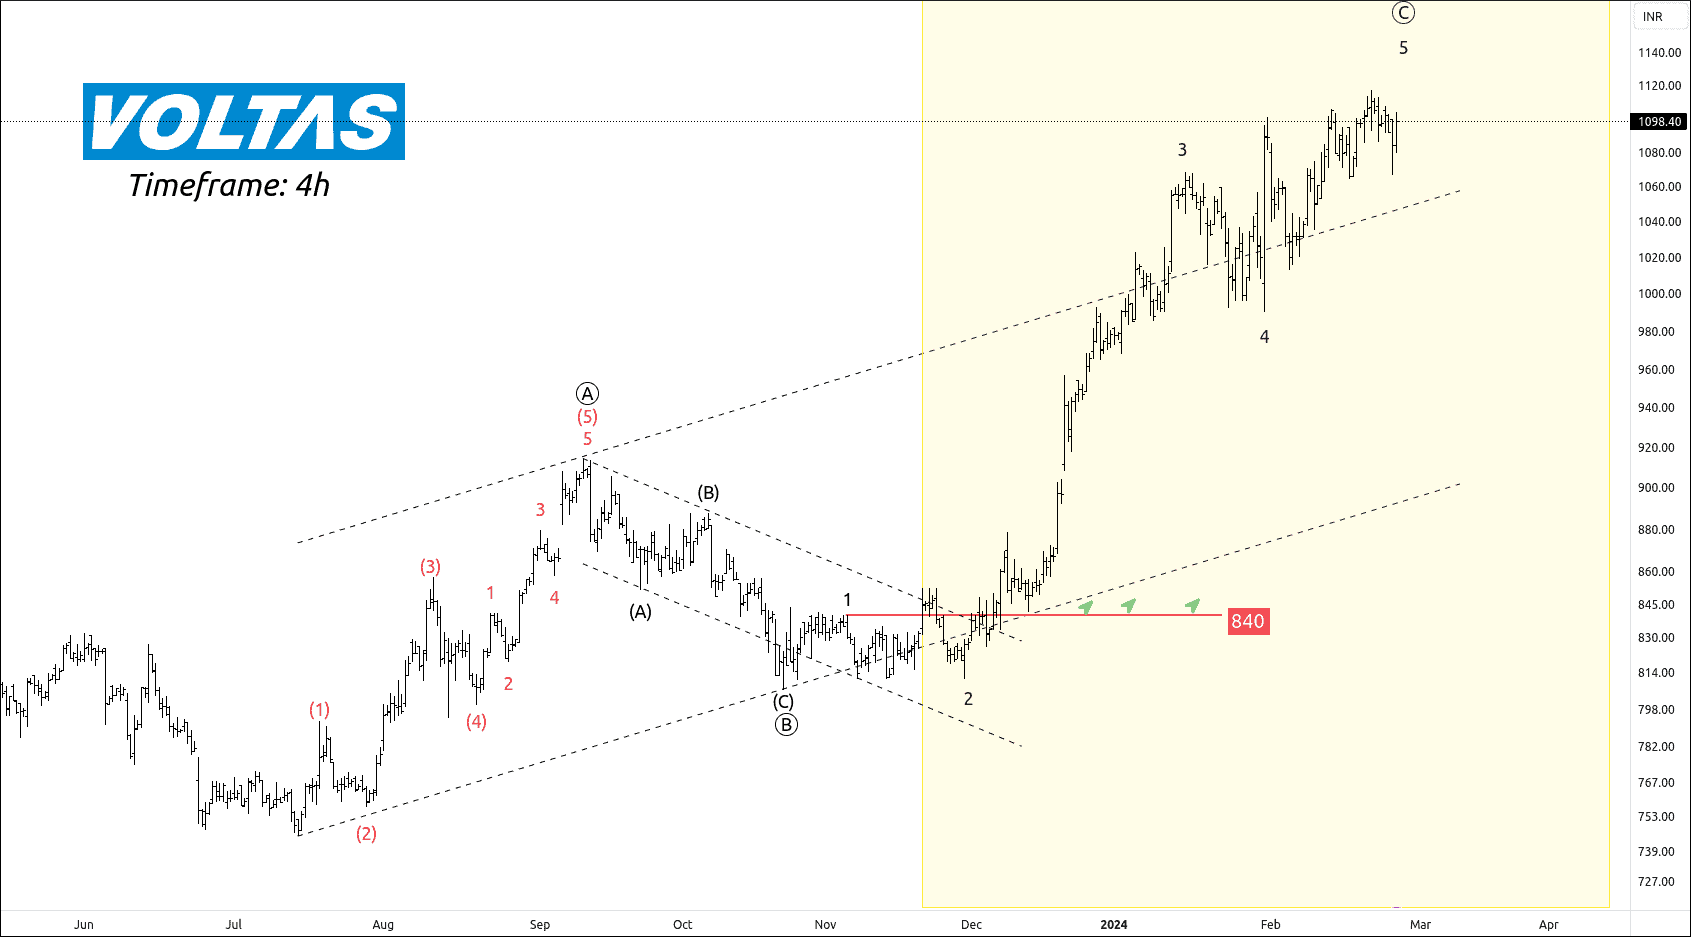
Free NSE Voltas chart callsAFTER

Timeline:

[08 December 2023]

  • 09:45 AM – NSE IDFC Touched the first target of 860.

[19 December 2023]

  • 10:30 AM – Price hit the second target of 880.

[20 December 2023]

  • 09:15 AM – NSE VOLTAS hit our final target of 904.

[15 January 2024]

  • 12:15 PM – Price made a high of 1068.

[21 February 2024]

  • 09:15 AM – NSE VOLTAS made a new high of 1117.

This Wave setup has given more than 32% return within 3 months.

We will update more Wave setups soon.

Continue reading

NSE IDFC – Bear Victory

Did you trade NSE IDFC Wave setup?
Click here: NSE IDFC – Elliott Wave Projection

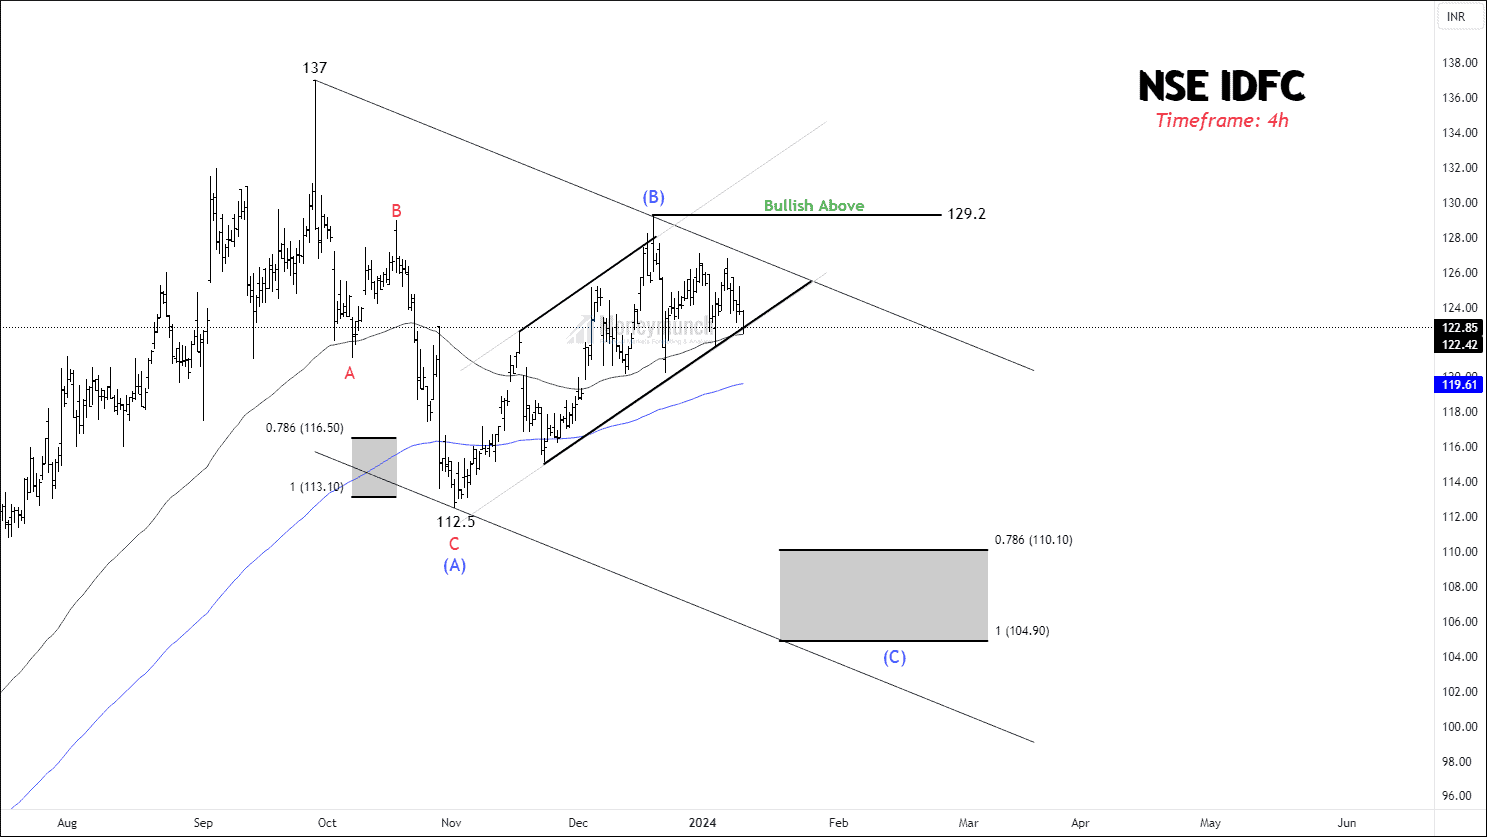
Free nse hdfc chart callsBEFORE

We had written clearly, “The angle from 112.5 to 129.2 looks bearish. If the price breaks down the lower band of Channel (B), traders can short for the following targets: 119 – 115 – 110+”

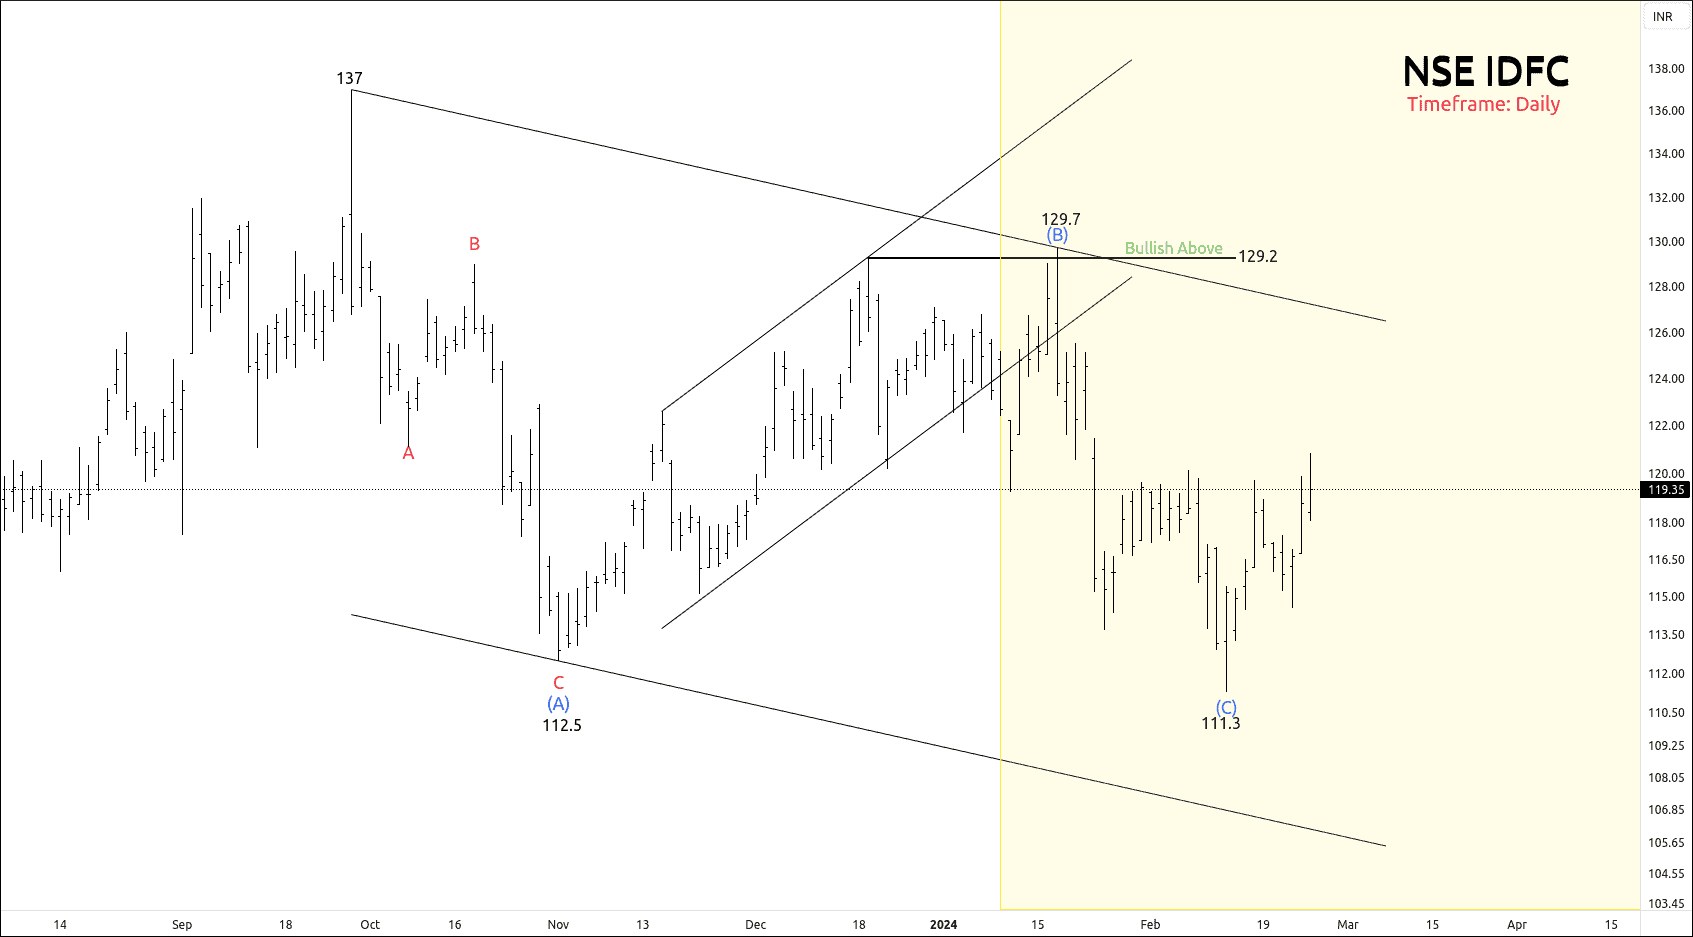
Free nse idfc chart callsAFTER

Timeline:

[23 January 2024]

  • 09:45 AM – NSE IDFC Touched the first target of 119.

[24 January 2024]

  • 09:15 AM – Price hit the second target of 115.

[13 February 2024]

  • 09:15 AM – Price made a new low of 111.3 which is close to our final target of 110.

This Swing setup was capable to provide more than 10% return.

We will update more setups soon.

Continue reading