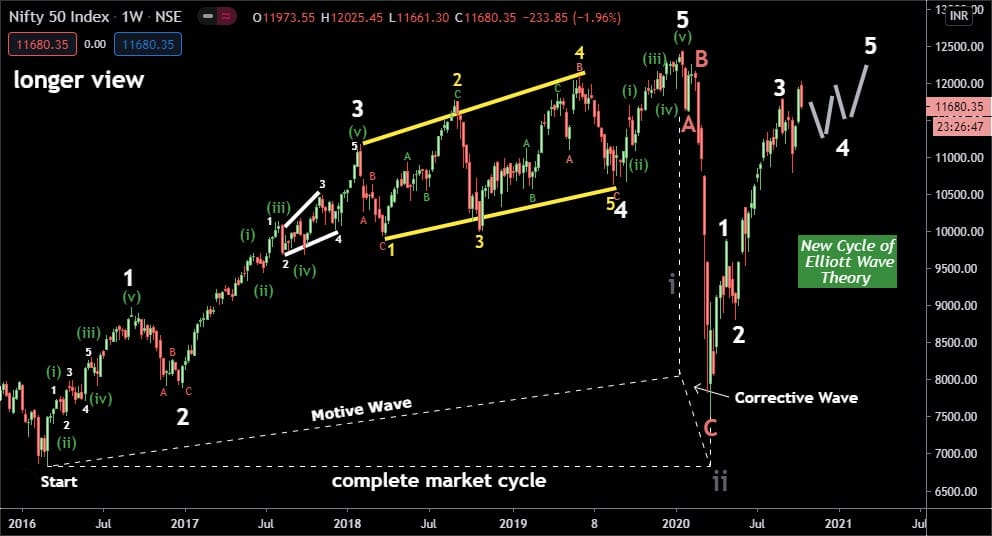
Have you enjoyed in NIFTY50 analysis?

In NIFTY50 it was suggested to sell from the peak you can see in the chart and from that point nifty has fall nearly 550 point.

Performance Chart

Have you remember NIFTY50 analysis if not -> CLICK HERE TO SEE

Hope all our members are enjoying our analysis.
To become a subscriber, subscribe to our free newsletter services. Our service is free for all.

Continue reading

NIFTY50 analysis with Elliott wave theory

Corrective Wave 2 is slightly higher than 50%.
The key learning here is Wave 3 important retracement levels as 261.8% at 12050 nearby and 11516 at 227.2%.

Impulsive Wave 3 is extended. When Wave3 is equal to 161.8% or more than it, it’s called as extended wave 3. In this case, you can see Wave 3 is extended. This is really important, because its decide wave 5. Wave 3 between the 261% to 227.2% ended.

Generally, Wave 4 traveled 38.2% to 50% in most of the case. More likely, expected fall or Wave 4 can be in rage of 11530-10070 before starting 2021.

Breaking down parallel channel will clear sign of corrective wave 4.

To become a subscriber, subscribe to our free newsletter services. Our service is free for all.

Continue reading

Have you enjoyed BANKNIFTY analysis?

BANKNIFTY Performance chart:

Have you remember analysis on BANKNIFTY Chart? If Not, –> Click Here to see

I had mentioned that Bank-nifty already started to look for the 4th Wave.

From Support : 32.8% at 23003=23134 & 50% at 22327, The price can travel for the 5th wave which can be above the 3rd wave.

Our First Target has been achieved by BANKNIFTY. Reversal is ready!

I hope everyone has enjoyed our FREE SERVICE

Did You Remember TCS analysis? –> Click here to see

I had mentioned that investors will be more active at that particular time and told to buy and go for longOn TCS  nearly 168 point bounce has come cheers everyone.

To become a subscriber, subscribe to our free newsletter services. Our service is free for all.

Continue reading

Bank nifty already started to look for the 4th Wave

I hope members are enjoying, isnt it?

The 80 points profit…

NIFTY50 NSE:
by keeping today’s high as stop-loss that is 11790
Sell nifty 11780-11773
Target 11700

To become a subscriber, subscribe to our free newsletter services. Our service is free for all.

Bank-nifty already started to look for the 4th Wave.
From Support : 32.8% at 23003=23134 & 50% at 22327, The price can travel for the 5th wave which can be above the 3rd wave.

Continue reading

Basics of Dow theory trading strategy forecasts

This CALL was given to our subscribers on 20-08-2020 (Our Target reached)

NIFTY50 NSE:
By keeping today’s low as stop-loss @11290, BUY 11310 second buy level 11325 TARGET 11375

Technical reason to buy NIFTY50 has open gap down to fill the gap it will move up, second over all market is bullish, third in a parallel channel nifty has taken support and moving up direction. You can still keep stop loss down and trade, But strictly follow stop-loss.

To become a subscriber, subscribe to our free newsletter services. Our service is free for all.

What is Dow theory?

The Dow theory is a financial theory that says the market is in an up-trend if one of its averages (i.e. industrials or transportation) advances above a previous important high and is accompanied or followed by a similar advance in the other average. For example, if the Dow Jones Industrial Average (DJIA) climbs to an intermediate high, the Dow Jones Transportation Average (DJTA) is expected to follow suit within a reasonable period of time.

What Is Support?
Support refers to the price level that an asset does not fall below for a period of time. An asset’s support level is created by buyers entering the market whenever the asset dips to a lower price. In technical analysis, the simple support level can be charted by drawing a line along the lowest lows for the time period being considered. The support line can be flat or slanted up or down with the overall price trend. Other technical indicators and charting techniques can be used to identify more advanced versions of support.

What Is Resistance?
Resistance, or a resistance level, is the price at which the price of an asset meets pressure on its way up by the emergence of a growing number of sellers who wish to sell at that price. Resistance levels can be short-lived if new information comes to light that changes the overall market’s attitude toward the asset, or they can be long-lasting. In terms of technical analysis, the simple resistance level can be charted by drawing a line along the highest highs for the time period being considered. Resistance can be contrasted with support.

What is support become resistance?
When price breaks the resistance, and after it will be created a support that same level this situation was called by support become resistance.

What is resistance become support?
When price breaks the support, and after it will be created a resistance that same level this situation was called by resistance become support.

How To Read The Support Level On the Chart?
Share prices which are subject to recurrent oscillations command the attention of investors at all times. Aiding investors make their move; it is significant for them to read the resistance level on the chart, which can bring a chance for them to make a good buy when the prices are balanced to rise higher.

How To Read The Resistance Level On Chart?
In disparity, when the price enters the resistance level, the market is noticeable of traders’ combat with a pressure to sell, when the price of the stock is balanced to fall further, going by its past performance.

Hence, these two factors are important for every investor to base his entry and exit moves in the share market when these determinants go a long way in representing the direction of the price of the stock, whether it will rise or drop.

Chart description:
The Stock has come to its support level in a parallel channel, investor will be more active at this level because of stock level higher high level.

“Buy 2236 or current level by keeping stop-loss 15-25 down and  go for long”.

TABLE OF CONTENTS

Candlestick and Chart Patterns (15 Days)

7 Most Important Candlestick Chart Patterns

Top 2 Bearish Chart Patterns

Top 6 Bullish Chart Patterns

Indicators & Oscillators (12 Days)

Bullish or Bearish Indicators

Bullish or Bearish Oscillators

Classic Chart Patterns (29 Days)

Bearish Classic Chart Patterns

Bullish Classic Chart Patterns

Best Trading Theories (4 Days)

Kind attention: this course is helpful for beginner and intermediate traders. It’s free for everyone. Advanced modules, trading strategies, and data (in-depth) are available for Moneymunch’s premium subscribers.

Get free important share market ideas on stocks & nifty tips chart setups, analysis for the upcoming session, and more by joining the below link: Stock Tips

Have you any questions/feedback about this article? Please leave your queries in the comment box for answers.

Disclaimer: The information provided on this website, including but not limited to stock, commodity, and forex trading tips, technical analysis, and research reports, is solely for educational and informational purposes. It should not be considered as financial advice or a recommendation to engage in any trading activity. Trading in stocks, commodities, and forex involves substantial risks, and you should carefully consider your financial situation and consult with a professional advisor before making any trading decisions. Moneymunch.com and its authors do not guarantee the accuracy, completeness, or reliability of the information provided, and shall not be held responsible for any losses or damages incurred as a result of using or relying on such information. Trading in the financial markets is subject to market risks, and past performance is not indicative of future results. By accessing and using this website, you acknowledge and agree to the terms of this disclaimer.

HDFC Bank Stock analysis, via Elliott wave theory

After forming a higher-high the stock has made next peak lower Presently if the stock move above 1071 it can be still bullish.
Wave 4 was finish at 942.65, Wave 5 is 0.78% of wave 4. In wave 5 mentioned a sub-wave with roman latter. A is retraced the range at 100% to1.61% of wave 5.
Wave b is 61.8% of wave A.
Wave 4 can not overlap wave 1, but sometimes it overlaps still follow Elliott wave theory, wave 2 can never exceed the start of wave 1.

Information on Elliott waves trading analysis to read click here 

To become a subscriber, subscribe to our free newsletter services. Our service is free for all.

Continue reading