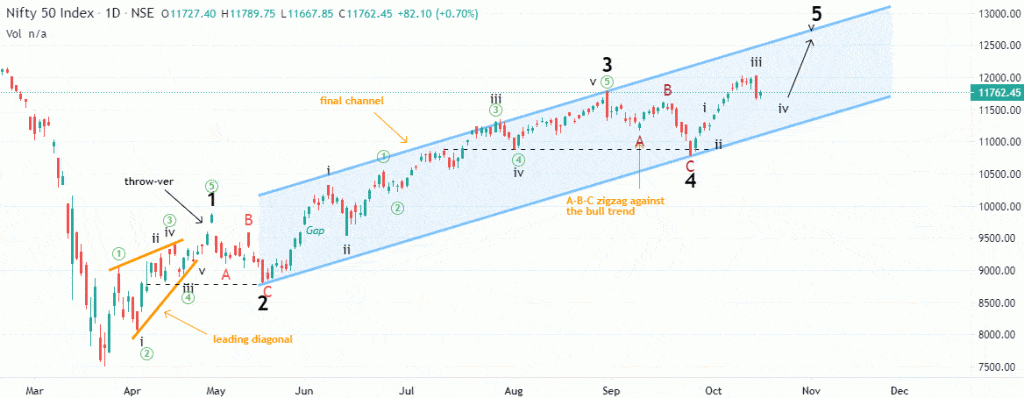
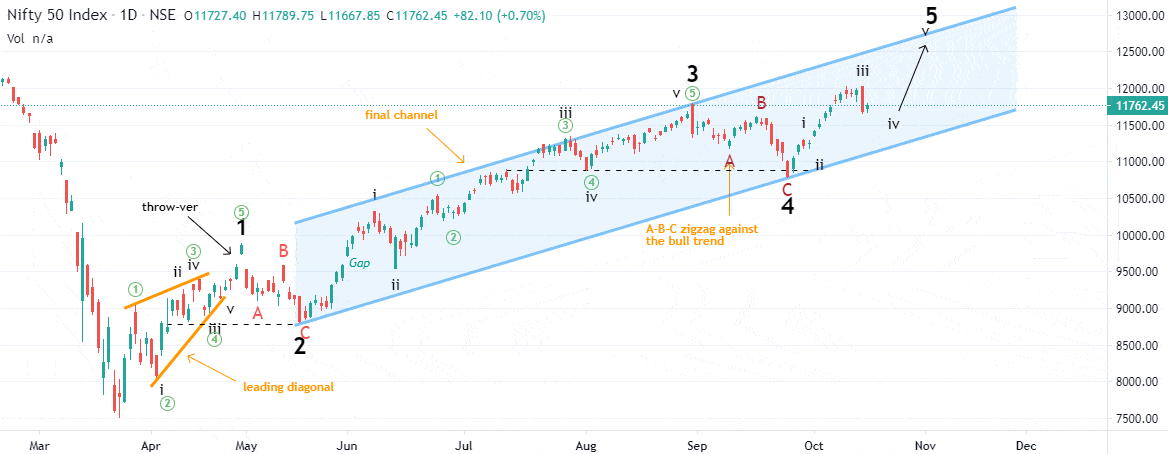
FIRST Wave: (Leading Diagonal Contracting)
In the first wave, we have detected the Leading Diagonal contracted within two yellow-colored covering lines but the leading diagonal occasionally appear in the first wave position of impulse. I have labeled by using roman numbers.
SECOND Wave: (The 50% Retraced)
Its a corrective wave formed A, B, and C. Its retraced 50% from the first wave and the price didn’t carry to a new low.
THIRD Wave: (Impulsive and Extended)
This wave is strong and broad with the Extension moved. The subdivisions of an extended wave are nearly the same amplitude and duration as required.
FOUR-Wave used Technique : (of Channeling to determine Five Wave)
I’ve used here channeling technique for confirmation of four-Wave completed perfectly. In this case, suppose to the fourth wave ends at a point touching the parallel channel.
FIVE Wave: (Price is currently toward this wave)
I have connected the ends of waves two and four to determine the five-wave causing wave one and three is normal.
To become a subscriber, subscribe to our free newsletter services. Our service is free for all.
Get free important share market ideas on stocks & nifty tips chart setups, analysis for the upcoming session, and more by joining the below link: Stock Tips
Have you any questions/feedback about this article? Please leave your queries in the comment box for answers.


These are awesome. Thank you!
It’s a rising to buy we’ll find more upstairs
Thank you for this information very useful
Great idea! Just one small remark. Please try shorter sentences. Cheers! ))
Thanks for sharing your update on nifty.
not to scrutinizing your analysis but curious to know which wave analysis is this since most of it looks like Elliott wave.
good charting of your style of modified wave.
Where have you learnt technical analysis. I want to learn, Pointers in chart are beyond my head.. For sure value there..
hey give me some tips man , I too need to trade some Options , do you have telegram channel ?
Market can go up and touch new highs again and again only “Sticking with current market trend”. Because, market is supreme!!
so u r view is NIFTY is going to correct from this level
Nice as always…! am just a learner……. following u from very long time
Any time frames, how many waves required,for next trend happen,….for smaller time Frames it required long chart????
Ma”am plss give ur mobile no.my whats app no. Is 8448135653
Agree with u we can go down this much before going up
Thank you very much for the the analysis, it’s really appreciated :)
Great analysis. Based on this channel, would this likely be the top for the year then?
Hey, Well said regarding the 12000 that is the next target level for me too. I believe 12k can be reached.
Very nice trendline channel. well it’s certainly within reach alright… I’d love to see that myself, so I’m hoping for it along with you!
lets see, if the price could go more than 12000 or declines. thanks
i would agree but right now it seems like its needs a little push to go up directly
nicely spotted. chart is great. I’ve got similar outlook.
all clear until at least 12 000. 12 500 also possible
on tech overshoot. see what we get now!