This call was given to our subscribers today.
NIFTY50: Sell 11986, Stop-loss 12027 and Target 11767
Sold at 11986- covered position 11767 = 219 PROFIT
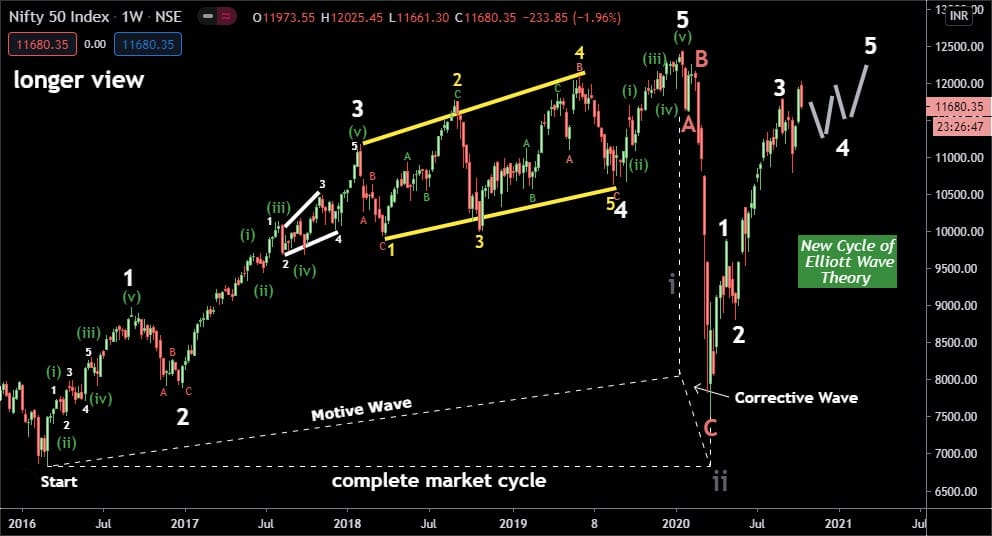
I have described the complete market cycle of Elliott7653 on the weekly chart of nifty as well as two model structural development which are Motive and corrective. Now that I’ve reviewed all types of waves, I can summarize their labels, as showed in the nifty chart.
To become a subscriber, subscribe to our free newsletter services. Our service is free for all.
Get free important share market ideas on stocks & nifty tips chart setups, analysis for the upcoming session, and more by joining the below link: Stock Tips
Have you any questions/feedback about this article? Please leave your queries in the comment box for answers.

amazing reading of chart … i was struggling to find from where nifty will fall and here you have given exact level …. remarkable
It’s ready to start next run. Another Good one i wish i could have subscribed on your last call given in nifty but now i will subscribe as early as possible.
thank you very much for giving me additional points where i can work upon to read & analyse chart.
So deep analysis, Very good and easy to understand Only attractive dividend is only satisfaction for the holders! It is an underdog for a pretty long period.
on nifty 219 point fall, wow that’s really a great call. if i calculate that i could have got profit of 16,425 nearly half the amount of subscription were recovered in just one call great. i will definitely subscribe soon.
Amazing work done!! I liked the simplicity in the chart! Keep this up!!
I think breaking down 11886 tomorrow could trigger fresh selling towards 11600.. breaking and closing above todays high which is at 11988 should trigger short covering rally towards 12200
Very nice study, appreciate your efforts to share it with others.