Globle: Short term analysis

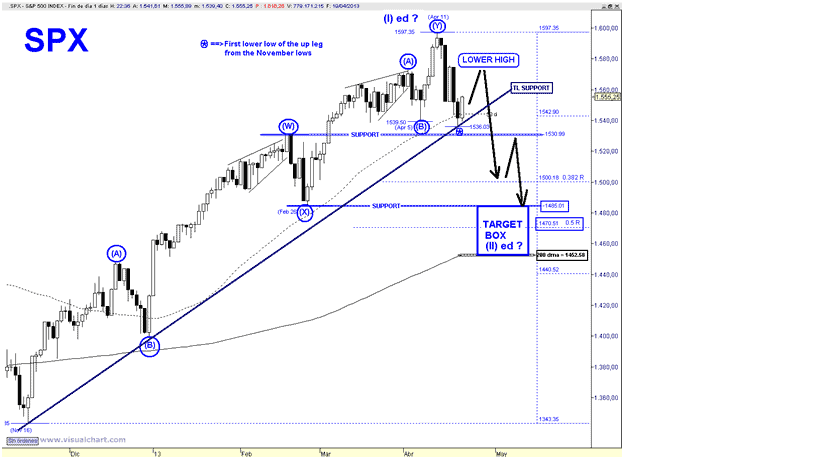
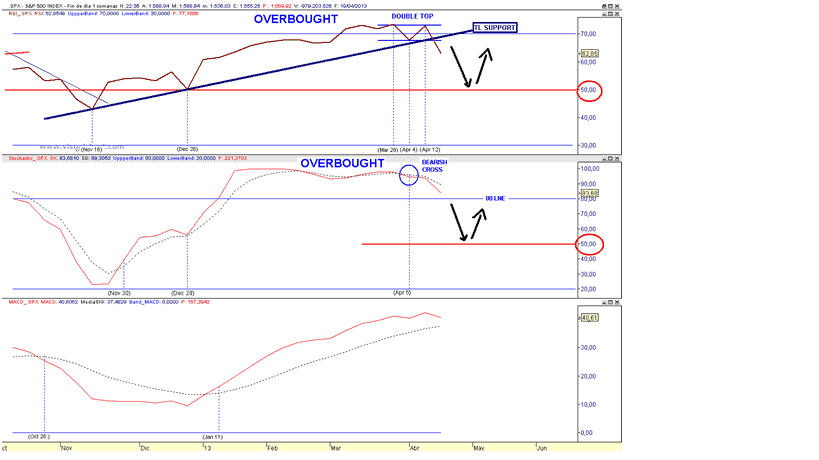
In my opinion the top of the up leg from the November lows is in place. We will have the absolute confirmation when price establishes a lower high. Below I show you the SPX weekly momentum indicators, where we can see that the RSI has breached the trend line support in force since the November 16 low. The next intermediate buy signal usually should occur when the RSI and the Stochastic retest the 50 line.

  1

I rule out a major reversal, instead I maintain the scenario of a retracement of the advance from the November lows. As I discussed last Friday the major reasons that suggest that price has not established a major top are:
  1. The up leg from the November lows has unfolded a corrective 7-wave structure ===> A corrective EWP cannot establish a major Top.
  2. The current pullback is also unfolding a corrective pattern, ===> The intermediate trend remains up.
  3. Retails investors are extremely bearish (I have never seen a major top with an extremely low AAII Bull ratio)
Regarding the potential target, at the moment, since we are in the initial stage of a corrective pattern I can only say that price should establish a bottom in the range 1485 – 200 DMA. (which today stands at 1453) Once a lower high is in place, the next down leg should aim at the 0.382 R = 1500, where probably a large rebound will take place. If bears maintain the sequence of lower high/lows then the following down leg will reach the target box.

3

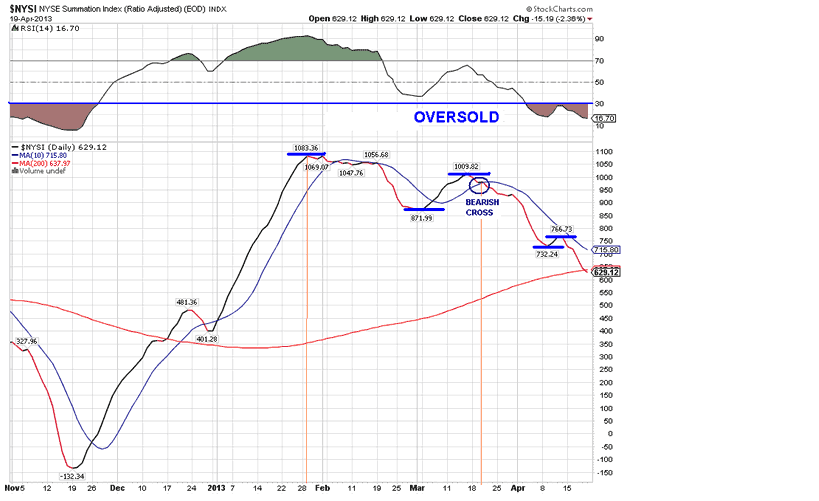
  Therefore, I reiterate that the above “road map” looks very probable as long as the bounce, which began last Friday, establishes a lower high. Regarding the long-term count, I maintain the Triple ZigZag wave (X) scenario. As I have discussed in previous weekly updates since the assumed wave (Z), which began at the November 2012 low is not impulsive I am suggesting that it should unfold an Ending Diagonal, if this is the case on April 11 price has completed the wave (I).   The summation Index, which, peaked at the end of January is already oversold (RSI has crossed the 30 line) and on Friday it has breached the 200 dma. It is remarkable that SPX has been able to establish higher highs with such a weak breadth performance. Going forward since price has just begun a corrective phase, an already oversold Summation Index should prevent a major decline.

 5

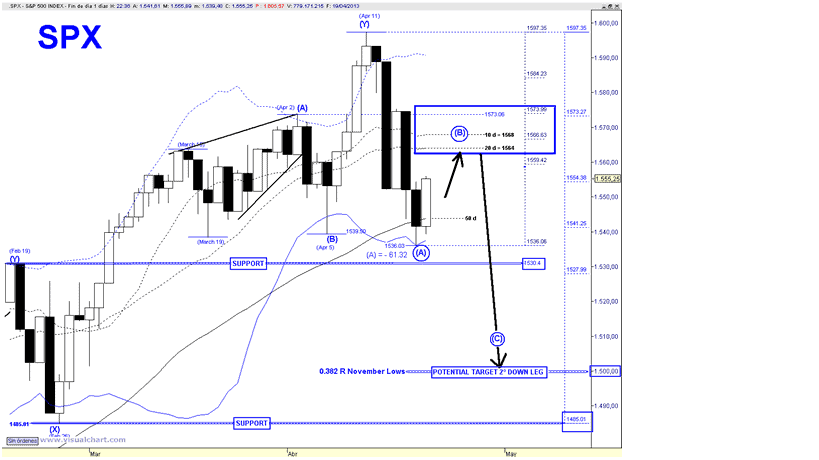
  Lets move on to the current price action. It is reasonable to expect that the rebound from last Thursday LOD to reach the target box delimited between the 20 DMA = 1564 and the 0,618 retracements = 1574. If it tops at the 20 DMA the 1×1 extension target for the following down leg would take us to the 0.382 retracement of the advance from the November lows at 1500. EW wise price would be unfolding a ZigZag therefore if lower prices were in the cards probably this initial ZigZag would morph into a Double ZigZag

6

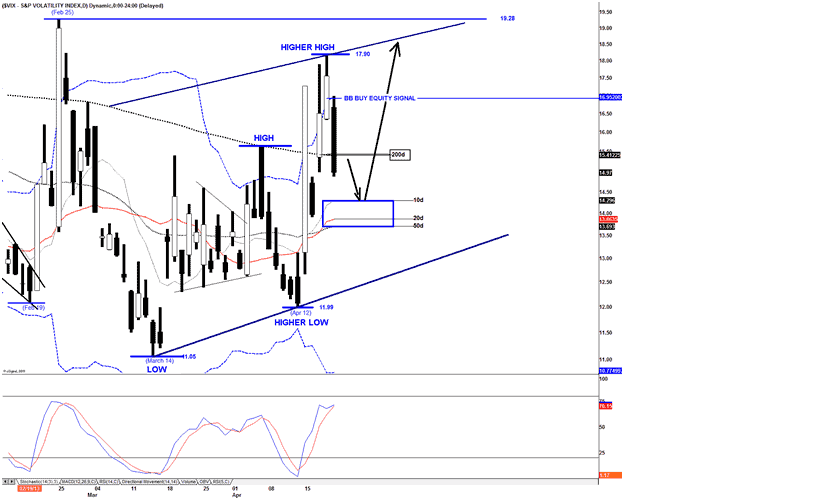
  Lastly, VIX on Friday has “issued a Bollinger Band buy equity signal”. Friday’s drop has been larger than I initially thought, moving back below the 200 DMA. I still expect a bottom in the range of the moving averages (10-20-50) or in the worst-case scenario at the rising trend line support in force since the March 14 low. The lower is the retracement, the larger will be the assumed SPX wave (B) rebound. I still think that the pattern that VIX is unfolding does not suggest a major move to the upside, but as long as the sequence of higher lows/highs is maintained the trend remains up. 7 To become a subscriber, subscribe to our free newsletter services. Our service is free for all.
Continue reading

Fiscal Cliff Navigation Tactics

Nov 20, 2012
  1. Earlier this year, Goldman Sachs’ Peter Oppenheimer said that compared to bonds, US stocks were the cheapest in 50 years.
  2. If Peter is correct, that could be good news for your gold stocks, because there is an ongoing correlation between the Dow and most gold equities.
  3. Unfortunately, Goldman also believes that the fiscal cliff situation could drive stock markets 8% lower by year-end.
  4. You are looking at the daily chart for the Dow, and you can see that it made a small top in mid-September. It has declined about 8% from the high.
  5. Gold stocks are more volatile than the Dow. GDX declined about 18%, during the period in which the Dow fell 8%. There is a lot of symmetry between these two charts.
  6. If the Dow is set to fall another 8% from the lows of last week, GDX could fall another 18% from its recent lows. That would put GDX at about $37, and below the May-July lows.
  7. Some of the largest gold companies are already trading near their summer lows, which is somewhat alarming.
  8. If you own a home, it is wise to purchase home insurance. If you own gold stocks, carrying some cash and short positions is a form of insurance. That’s the daily chart of DUST, which is effectively a triple-leveraged bet against GDX. The performance is calculated on a daily basis. I’m a buyer, moderately, in the $28 and $22 areas.
  9. What would happen to gold stocks, if Goldman Sachs is correct about the Dow falling another 8%, and then they called for an even harder fall, instead of a rally?
  10. The situation could get quite ugly. A small position in DUST may help gold stocks investors to professionally manage fiscal cliff fear.
  11. Gold recently sold off along with the other so-called “risk on” markets, but it bottomed quickly. The daily chart shows a nice head and shoulders bottom pattern in play.
  12. The daily gold chart looks superb. The H & S pattern sits near the demand line of a beautiful rising channel.
  13. HSR (horizontal support & resistance) at $1758 is the initial upside target, and then $1800. A “price pop” to the $1825 price zone could be a game changer for gold stocks.
  14. Silver looks even better than gold. Yesterday’s price action was important, because it took silver above the neckline of a head and shoulders bottom.
  15. At this point in time, gold has yet to rise above its neckline, so silver is clearly the leader.
  16. Silver seems eager to race to $35.50, and if gold can rise above $1800, that could catapult silver into the $40 range.
  17. There’s more good news. Ben Bernanke makes a speech in New York today, and he may give more hints about ramping up QE3. Currently, QE3 is being “diluted”, because the Fed is selling short term Treasuries.
  18. There are rumours that the Fed may cut back on that practice, or even halt it, before the end of the year. If “Big Ben” speaks boldly about ending the dilution of QE3, gold and silver could spike higher, very quickly.
  19. Most investors in the gold community like speculative resource stocks. If you are looking for action, my favourite play right now is the “Global X Gold Explorers” fund.
  20. At about $8 a share, the GLDX ETF is something that is probably priced “just right”, for action-oriented investors. In contrast, GDXJ is trading at about $22.
  21. It’s a lot easier to look down from $8, than it is from $22. Aggressive investors should considering accumulating GLDX on every 25 cent decline, inside the highlighted $7-$9.75 “price box”.
  22. I like both GDXJ and GLDX, but there’s no question that GLDX is a lot easier to handle, emotionally.
  23. A move above $1800 in gold could be the catalyst that takes GLDX above $10. From there, the target would be $13, which is about 50% higher than today’s price!

What Happens To Debt After You Die?

Death is inescapable, there is no way to escape from it. Similarly, you can’t run away from few kinds of Debts – and these debts are like “once a person is owing money, and die;  someone has to pay for it”. For example co-singers who sign onto student loans are held accountable for the money being loaned to be paid back as well.

This infographic from Total Bankruptcy tells you the same story with many angles – it can help you to have an idea about what happens to your debt when you die.

Sell The Great Britain Pound Against US Dollar

Sell The Great Britain Pound Against US Dollar

Sell GBPUSD 1.5689

Small heart traders 1.5646

Lion heart traders can wait for 1.5500

If today it close below 1.5500

Then 1.5550 – 1.5400 below

To become a subscriber, subscribe to our free newsletter services. Our service is free for all.

Continue reading