Global market

Globle: Short term analysis

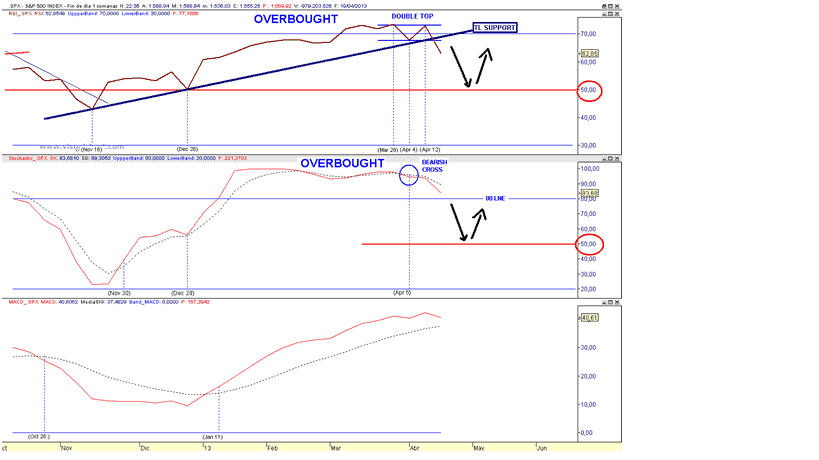
In my opinion the top of the up leg from the November lows is in place.

We will have the absolute confirmation when price establishes a lower high.

Below I show you the SPX weekly momentum indicators, where we can see that the RSI has breached the trend line support in force since the November 16 low.

The next intermediate buy signal usually should occur when the RSI and the Stochastic retest the 50 line.

 
1

I rule out a major reversal, instead I maintain the scenario of a retracement of the advance from the November lows.

As I discussed last Friday the major reasons that suggest that price has not established a major top are:

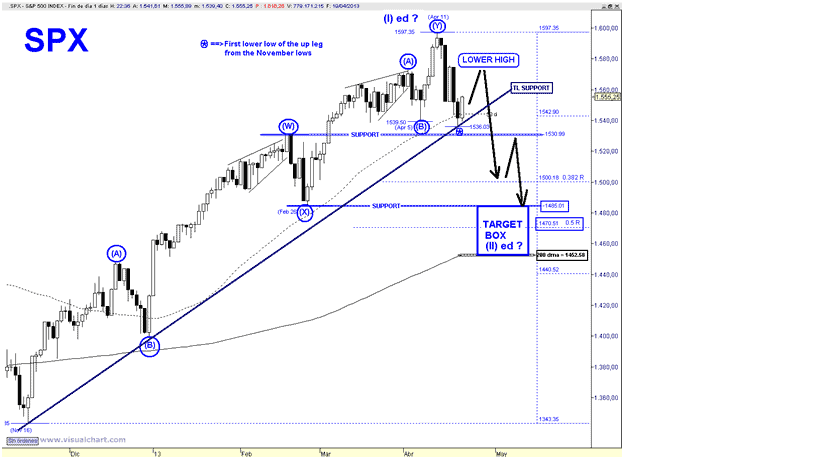
  1. The up leg from the November lows has unfolded a corrective 7-wave structure ===> A corrective EWP cannot establish a major Top.
  2. The current pullback is also unfolding a corrective pattern, ===> The intermediate trend remains up.
  3. Retails investors are extremely bearish (I have never seen a major top with an extremely low AAII Bull ratio)

Regarding the potential target, at the moment, since we are in the initial stage of a corrective pattern I can only say that price should establish a bottom in the range 1485 – 200 DMA. (which today stands at 1453)

Once a lower high is in place, the next down leg should aim at the 0.382 R = 1500, where probably a large rebound will take place. If bears maintain the sequence of lower high/lows then the following down leg will reach the target box.

3


Therefore, I reiterate that the above “road map” looks very probable as long as the bounce, which began last Friday, establishes a lower high.

Regarding the long-term count, I maintain the Triple ZigZag wave (X) scenario. As I have discussed in previous weekly updates since the assumed wave (Z), which began at the November 2012 low is not impulsive I am suggesting that it should unfold an Ending Diagonal, if this is the case on April 11 price has completed the wave (I).

  The summation Index, which, peaked at the end of January is already oversold (RSI has crossed the 30 line) and on Friday it has breached the 200 dma. It is remarkable that SPX has been able to establish higher highs with such a weak breadth performance.

Going forward since price has just begun a corrective phase, an already oversold Summation Index should prevent a major decline.

 5


Lets move on to the current price action.

It is reasonable to expect that the rebound from last Thursday LOD to reach the target box delimited between the 20 DMA = 1564 and the 0,618 retracements = 1574.

If it tops at the 20 DMA the 1×1 extension target for the following down leg would take us to the 0.382 retracement of the advance from the November lows at 1500.

EW wise price would be unfolding a ZigZag therefore if lower prices were in the cards probably this initial ZigZag would morph into a Double ZigZag

6


Lastly, VIX on Friday has “issued a Bollinger Band buy equity signal”. Friday’s drop has been larger than I initially thought, moving back below the 200 DMA. I still expect a bottom in the range of the moving averages (10-20-50) or in the worst-case scenario at the rising trend line support in force since the March 14 low. The lower is the retracement, the larger will be the assumed SPX wave (B) rebound.

I still think that the pattern that VIX is unfolding does not suggest a major move to the upside, but as long as the sequence of higher lows/highs is maintained the trend remains up.

7

To become a subscriber, subscribe to our free newsletter services. Our service is free for all.

Get free important share market ideas on stocks & nifty tips chart setups, analysis for the upcoming session, and more by joining the below link: Stock Tips

Have you any questions/feedback about this article? Please leave your queries in the comment box for answers.

Disclaimer: The information provided on this website, including but not limited to stock, commodity, and forex trading tips, technical analysis, and research reports, is solely for educational and informational purposes. It should not be considered as financial advice or a recommendation to engage in any trading activity. Trading in stocks, commodities, and forex involves substantial risks, and you should carefully consider your financial situation and consult with a professional advisor before making any trading decisions. Moneymunch.com and its authors do not guarantee the accuracy, completeness, or reliability of the information provided, and shall not be held responsible for any losses or damages incurred as a result of using or relying on such information. Trading in the financial markets is subject to market risks, and past performance is not indicative of future results. By accessing and using this website, you acknowledge and agree to the terms of this disclaimer.

Previous ArticleNext Article
The Moneymunch editorial staff is a team of experienced financial writers and analysts with over a decade of experience in the financial markets. They have previously contributed to popular financial blogs and newspapers, and are passionate about providing accurate and up-to-date information to help both investors and traders make informed decisions. Trust the Moneymunch editorial staff to provide reliable and effective financial advice that can help you achieve your financial goals.

Write a Comment

Comment Policy: We love comments and appreciate the time that readers spend to share ideas and give feedback. However, all comments are manually moderated and those deemed to be spam or solely promotional will be deleted. Your email address will not be published. Required fields are marked *