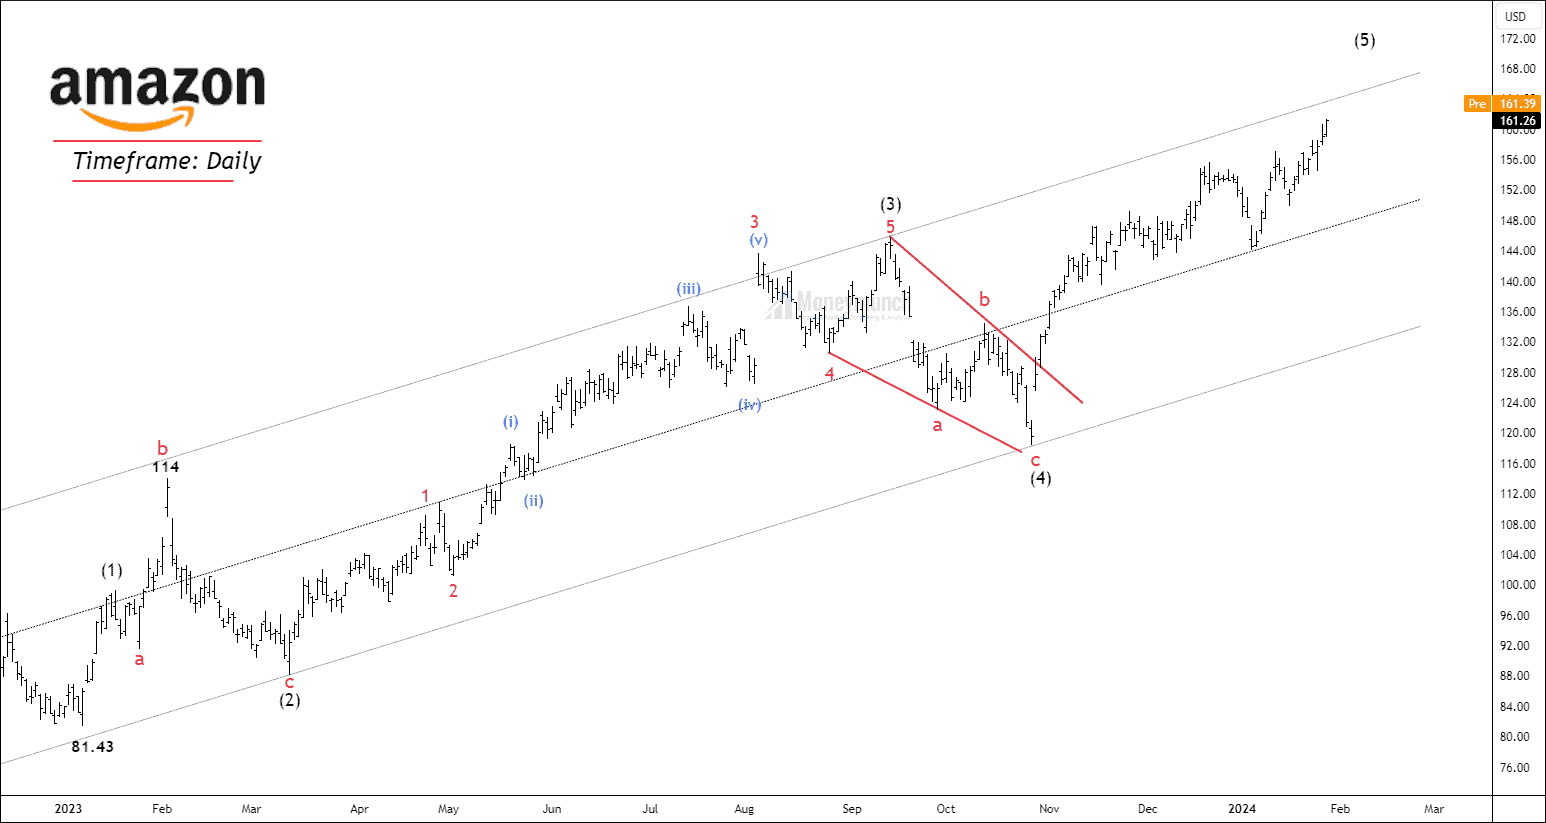
NASDAQ AMAZON – Wave Strength Analysis On Daily Chart
NASDAQ AMZN has started an impulsive cycle from 81.33, and the price is forming the final wave (5). The price has accomplished a corrective wave (4) and formed sub-waves of the impulsive wave (5). Wave Formation & Fibonacci relationships: Wave (2):
- Wave 2 has formed an expanded flat with a 3-3-5 structure.
- Price retraced 78.6% of wave (1).
- Wave 3 has constructed a motive structure.
- Wave 3 is an extensive wave with a 3.618 multiple of wave (1).
- The sub-structure and element structure is visible.
- Wave 4 is a zigzag formation and can be mentioned as a triangle by changing the labels.
- Wave (4) retraced 50% of wave (3).
- The structure of wave (5) does not look like an ending diagonal. So, the last option for us is to assume it is an impulse.
- The common Fibonacci relationships are: – Wave 5 = Wave 1 – Wave 5 = 0.618 reverse Fibonacci of wave 4 – Wave 5 = 0.618 X Waves 1 through 3 – The upper band of the parallel channel and throw-out out in many cases.
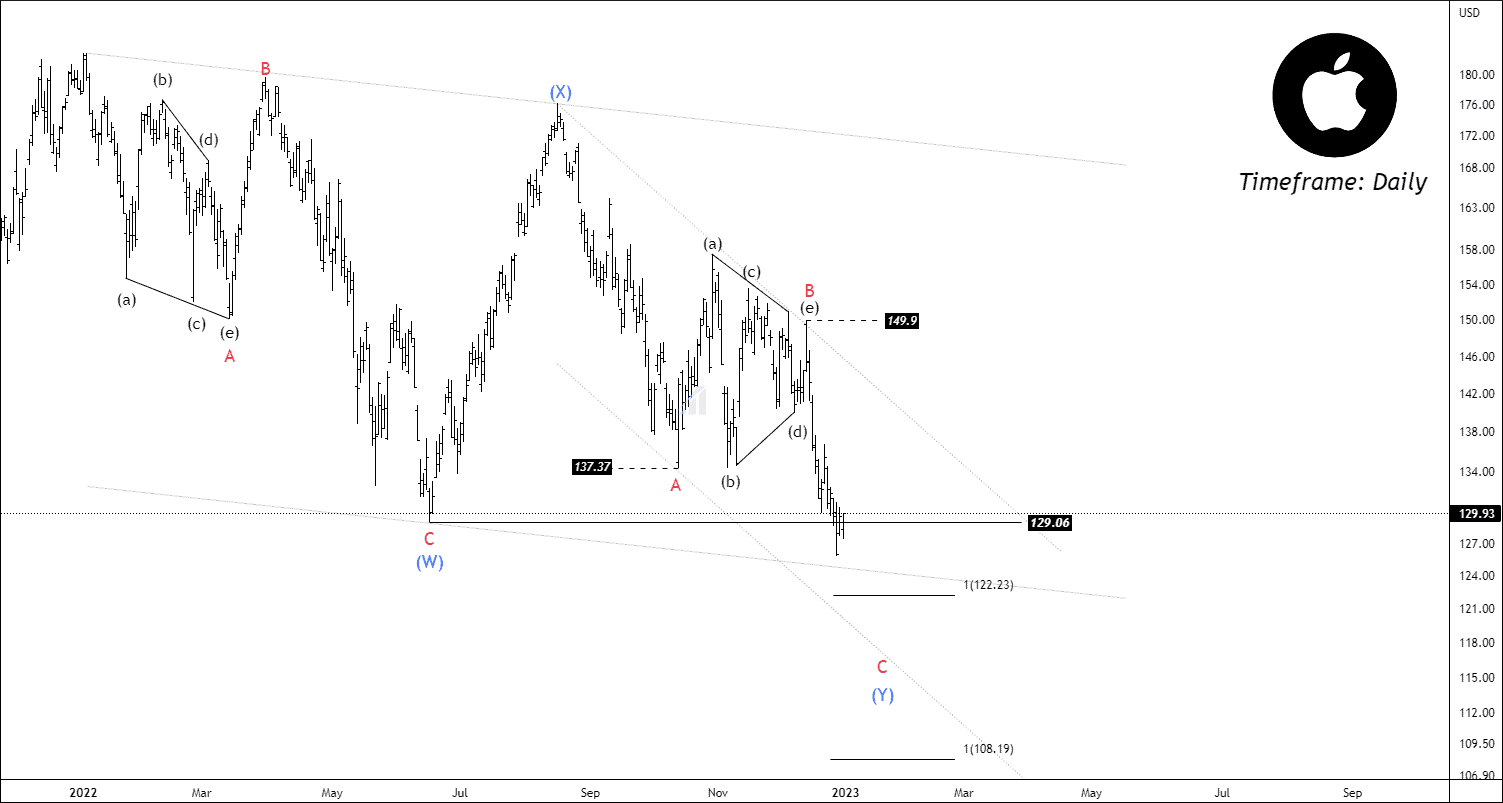
NASDAQ AAPL – Elliott Wave Projection
USDINR’s Trade Setup for Subscribers
 Unlock This Article
Only subscribers can read the full article. Please login to read the entire article.
Market overview: US unemployment claims below forecasts
 The monthly unemployment report is likely to be a victim of the US government shutdown
1330: Initial weekly US unemployment claims rose by 1,000 to 308,000 in the week ended on September 21st, versus the 315,000 expected by economists.
1320: Vodafone’s CFO will step down from his role of nine years once the sale of its stake in Verizon Wireless completes. The stake, which is being sold for 80bn pounds, is expected to be sold by March 2014. The FTSE has risen 24 points to 6,461.50.
1242: Overnight the Chicago Mercantile Exchange (CME) hiked its margin requirements for operators in the Dow Jones, SP 500 and Nasdaq E-Mini futures contracts by nine per cent. According to Zerohedge that may be a result of President Obama’s remarks to the effect that Wall Street has not yet recognized the seriousness of the current impasse on Capitol Hill.
1120: A little more colour on Aviva, in remarks to Sharecast Ronni Chopra – Head of Strategy at Trade next – pointed out that in the medium-term the stock might still be a potential take-over target. FTSE 100 up 17 to 6,454.
Currency Strength and Central Bank and Gold?
 The crucial story for gold investors is not the pure inflation rate of the dollar, but something much deeper. When you focus on gold, you should sharpen the focus of your lens on the dollar system. As history confirms, gold can both increase and decrease under inflationary circumstances. It is also the case when considering the opposite scenario, which is deflation. It all depends on how well the dollar system is performing (how well is both dollar as a currency and dollar understood as dollar denominated assets; bonds, stocks, derivatives, credits etc.).
The easiest way to look at the dollar is to compare it as a currency against all the other currencies. This, in fact, was the best way to assess the dollar from 2002-3, when it started to lose its value against other currencies and gold began its long and spectacular upward climb. This took place while a bubble formed in dollar denominated assets, especially real estate.
In 2008 there was a radical shift. Shortage of liquidity in the financial markets lead to massive selloffs of assets in all markets, with emerging markets being hit the most. That’s when the dollar got a gust of air in its sails, and increased significantly in value. Under current circumstances, the dollar – as a currency – does not appear to look that bad. Even when compared to other strong currencies, the dollar looks firm. The central bankers who print the British pound and the Japanese yen seem to be devaluation devotees, and the euro is still recoiling from the turmoil of numerous internal problems.
Therefore, when looking purely at the currency markets, the dollar does not appear as endangered as it may seem. However, as we hinted at the beginning, this is not the whole story. We have to assess not only the dollar against other currencies, but the entire dollar system, that is dollar denominated assets. The dollar may be a better investment than the British pound, but the big question is whether gold may be an even better investment than the dollar even when it outperforms the pound.
So how is the dollar system performing internally? One of many possible things to focus on is the interventionist policy of the government, especially the central bank. This can tell us how firmly the economy stands.
In recent years we witnessed tremendous expansion in the Fed’s activity. Since it all comes down to money creation (supplied for financial papers and bonds), this influence is rather negative for the whole dollar system. This means that from the economic point of view, the outlook for gold is quite favorable for the coming years.