Indian currency updates for our Members only by mail

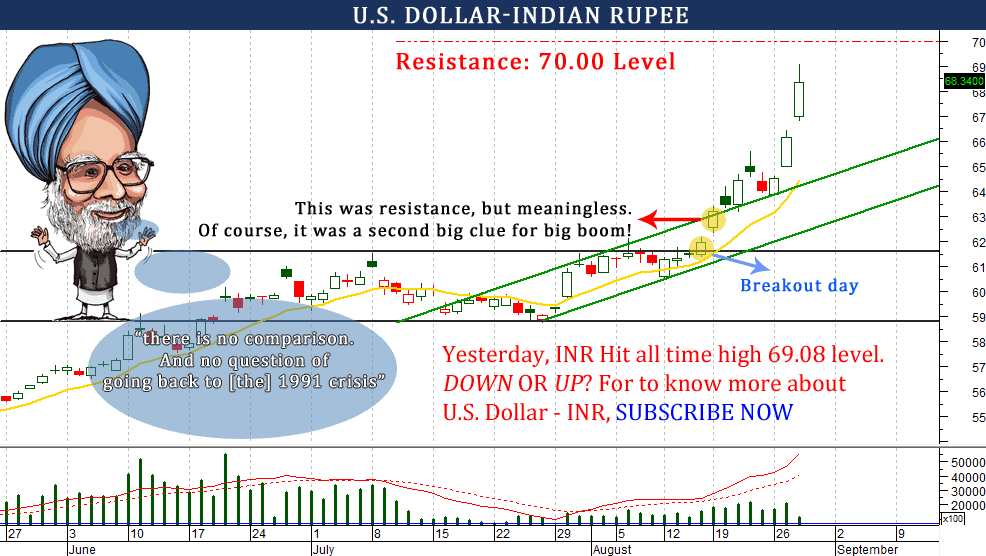
Couple of up trading sessions today it looks weak.
Sell with no fear, with the targets 1.6100 – 1.6075.
Stop loss for members only

 Unlock This Article
Only subscribers can read the full article. Please login to read the entire article.
It should continue to rally 0.9444 – 0.9469 with support 0.9411.
Brake of support, and we must see bloodbath to 0.9393 and more.

EURUSD kiss all my targets
Don’t you remember what I said in my last update? Click here to read,
I said to “EURUSD hurdle is 1.3405 and if cross my hurdle then we look at 1.3547”
Now what for now?
Today just watch it should continue rally to 1.3560 or 1.3581
What will happen if breaks the support?
We will update further information soon.
Continue reading