MCX CRUDEOIL & GOLD – Big Pictures
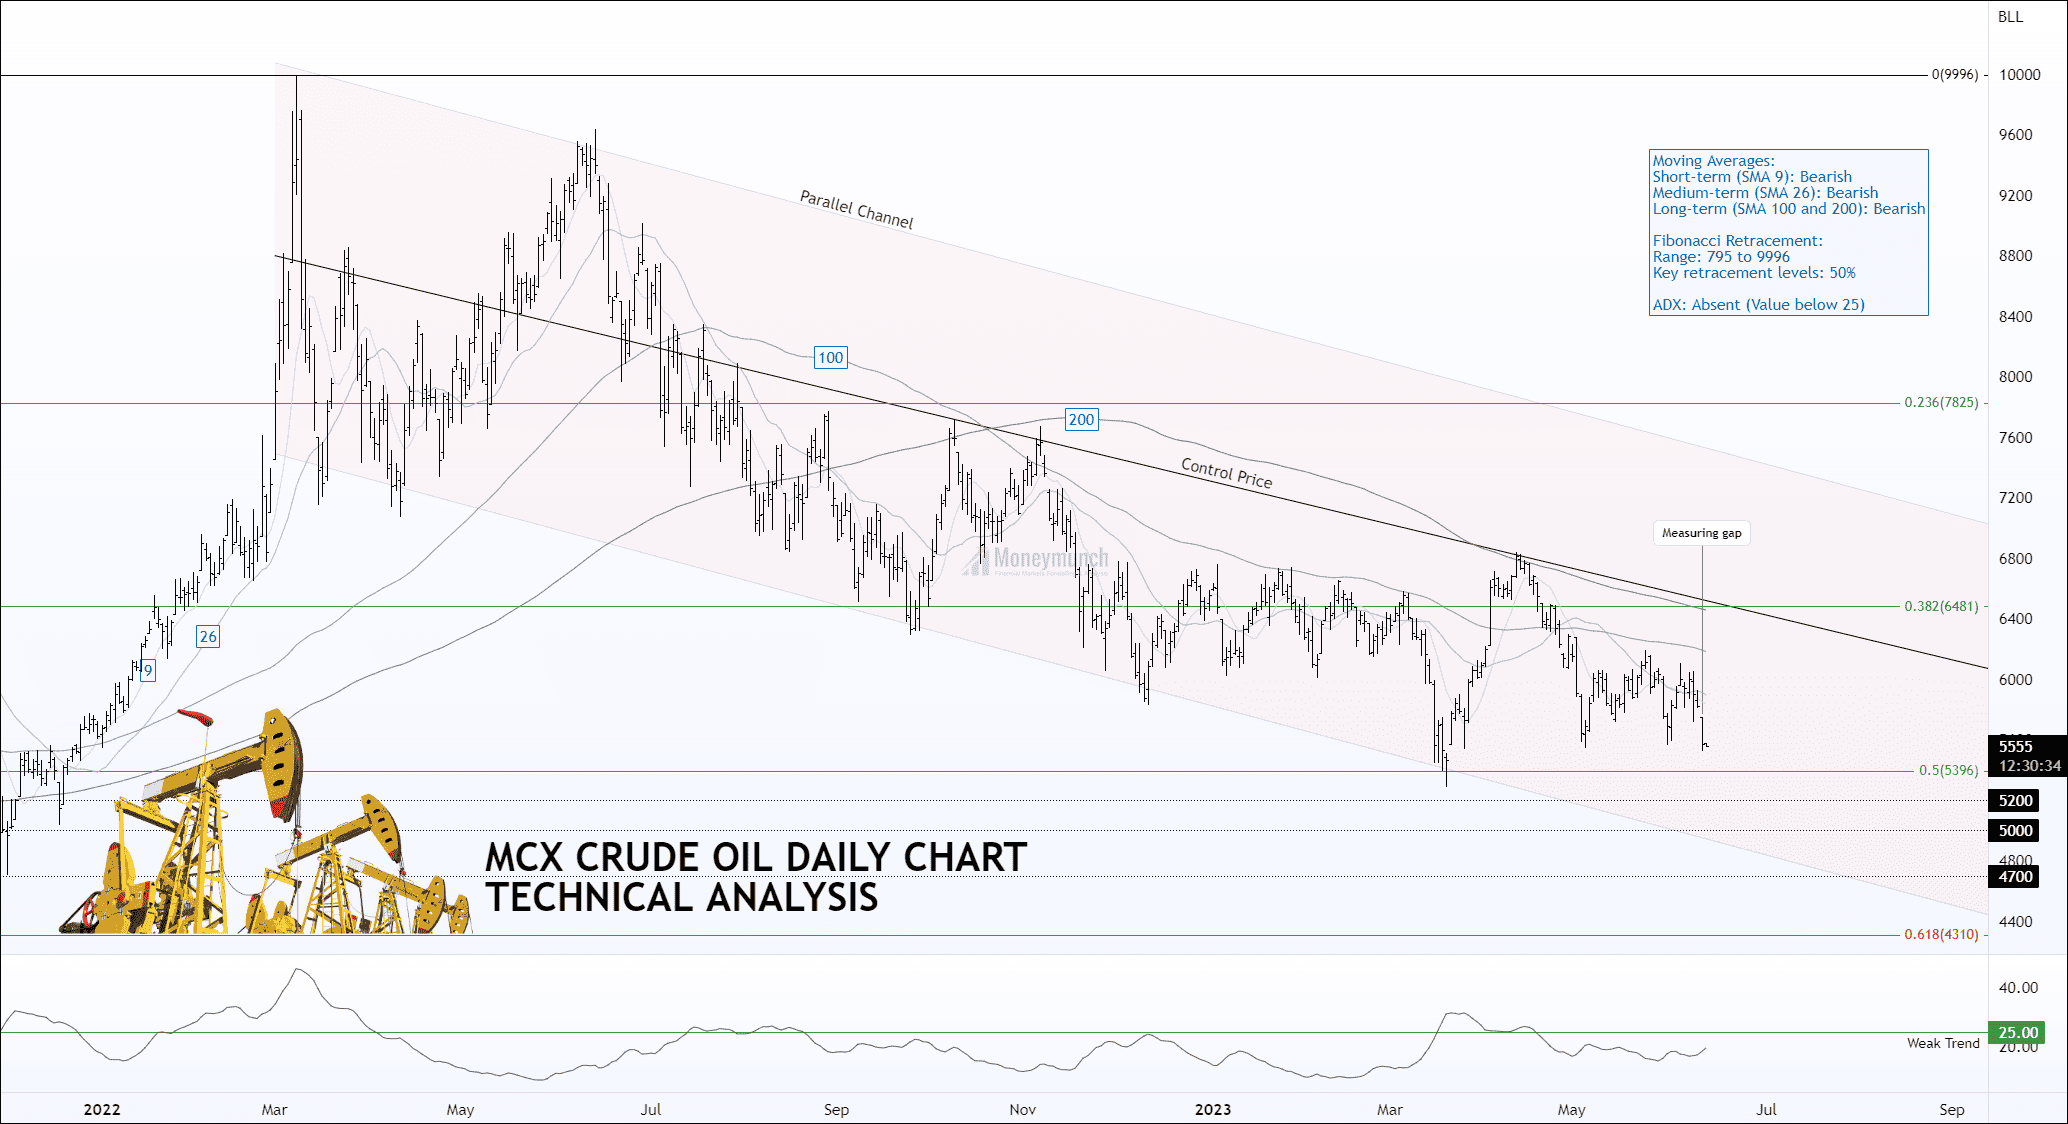
Bearish signals remain for crude oil price
Timeframe: Daily
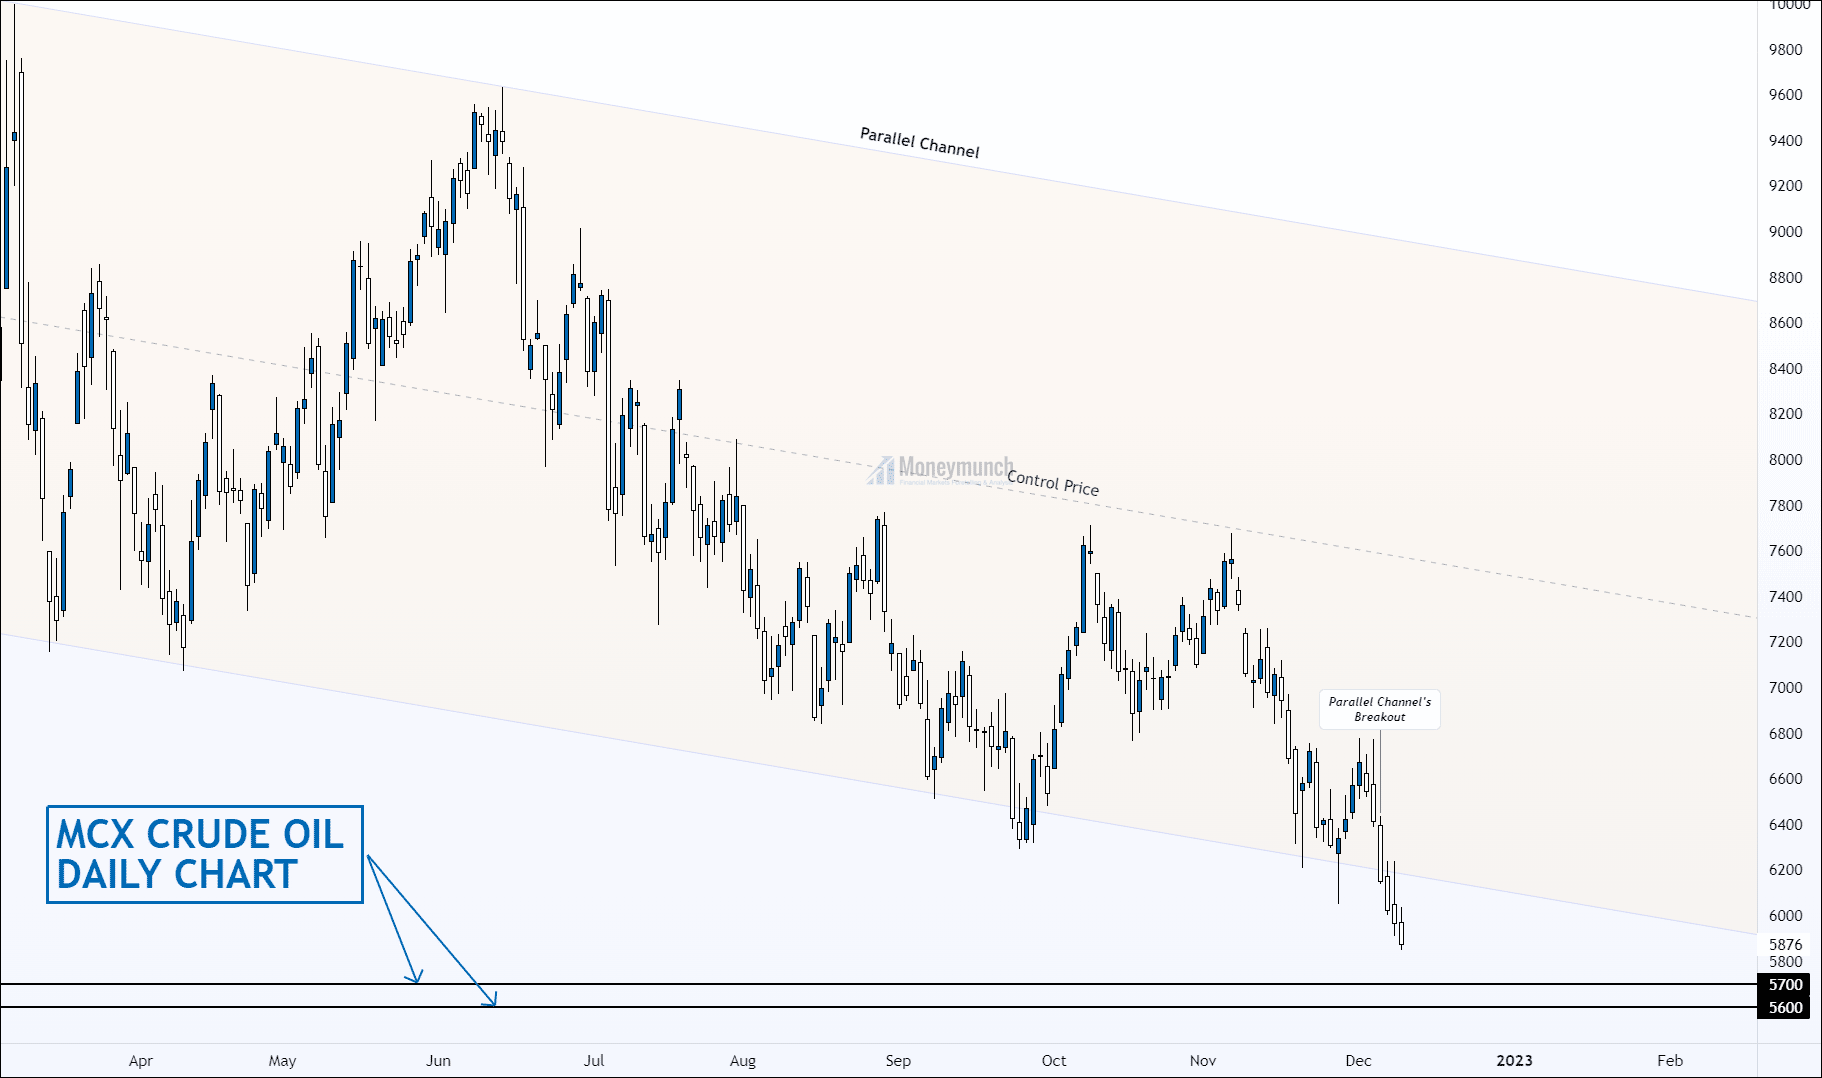
After making a high of 9996, the price started forming a descending channel. The channel has been occurring for more than 39 weeks. 7735 was a crucial resistance level where the price tried to test for three attempts but failed to maintain bullish momentum.
The price has broken down the descending parallel channel and closed below the recent lower low to create a new low. Bearish momentum can lead price to the following targets: 5700 – 5600.
Trade will be invalid if the price sustains above the upper band of the descending parallel channel.
Subscribers will have excess to further information soon. (To become a subscriber, subscribe to our free newsletter services. Our service is free for all.)
Will Gold survive above the 55000 level?
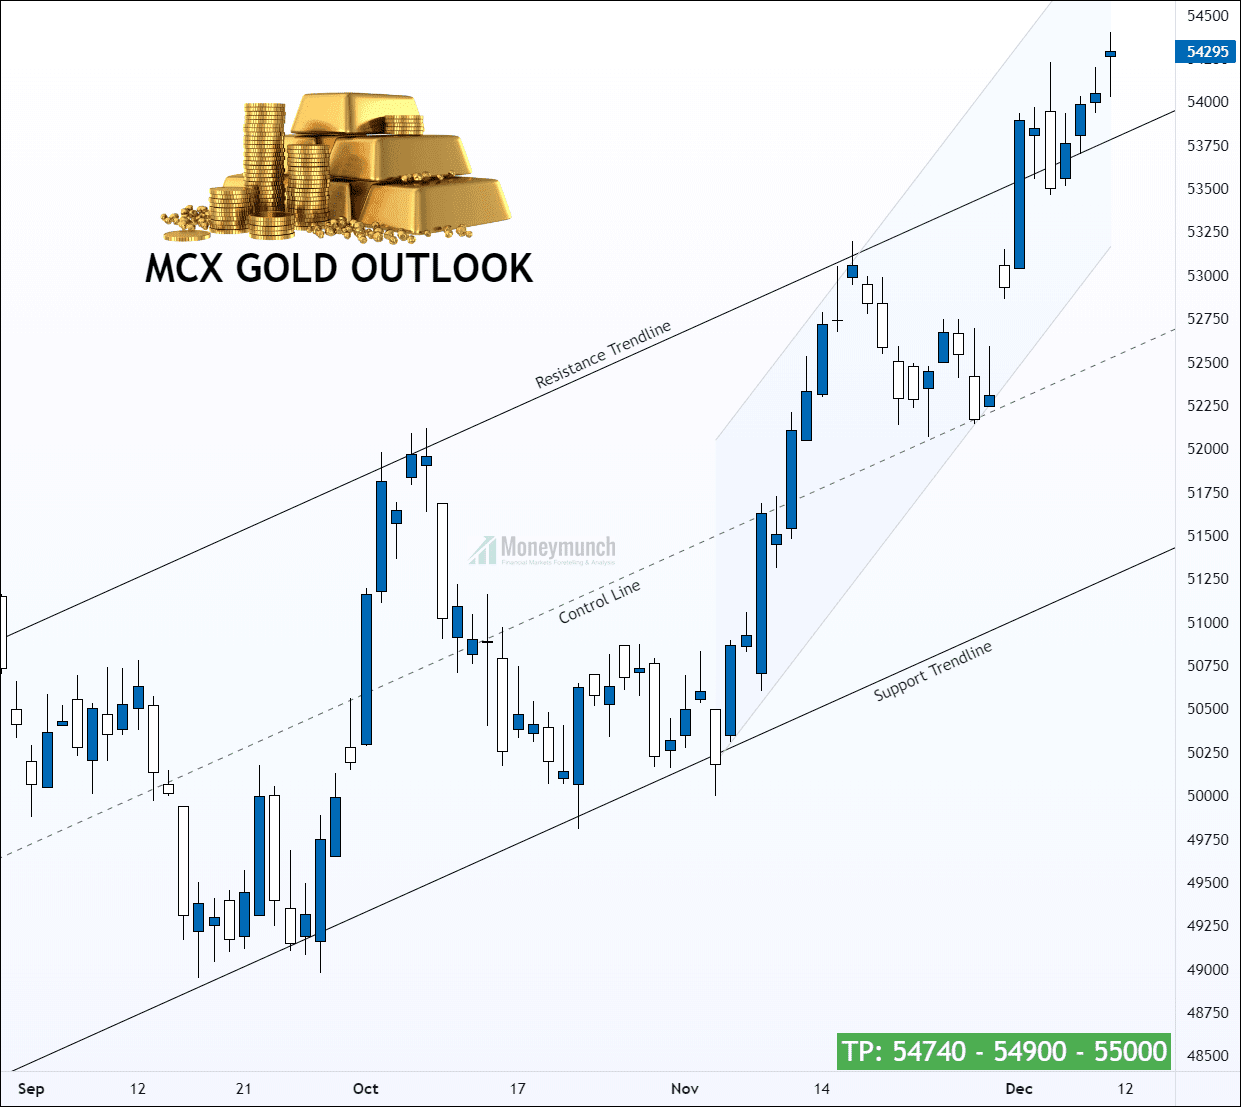
Timeframe: Daily
MCX GOLD has broken out of the 10-week-old upper resistance band of the parallel channel and moving forward to the crucial resistance of 55000.
After breaking the swing high of 53663, the price faced resistance until demand pressure turned the level into support. Currently, gold is showing a bullish sentiment, which may lead to the following targets: 54740 – 54900 – 55000+.
Note: the resistance line is currently providing support after the breakdown, but closing into the channel will increase selling pressure.
We will update further information soon.
Get free MCX ideas, chart setups, and analysis for the upcoming session: Commodity Tips →
Have you any questions/feedback about this article? Please leave your queries in the comment box for answers.
Disclaimer: The information provided on this website, including but not limited to stock, commodity, and forex trading tips, technical analysis, and research reports, is solely for educational and informational purposes. It should not be considered as financial advice or a recommendation to engage in any trading activity. Trading in stocks, commodities, and forex involves substantial risks, and you should carefully consider your financial situation and consult with a professional advisor before making any trading decisions. Moneymunch.com and its authors do not guarantee the accuracy, completeness, or reliability of the information provided, and shall not be held responsible for any losses or damages incurred as a result of using or relying on such information. Trading in the financial markets is subject to market risks, and past performance is not indicative of future results. By accessing and using this website, you acknowledge and agree to the terms of this disclaimer.
Is Crude Oil forming wave (5) of its wave cycle?
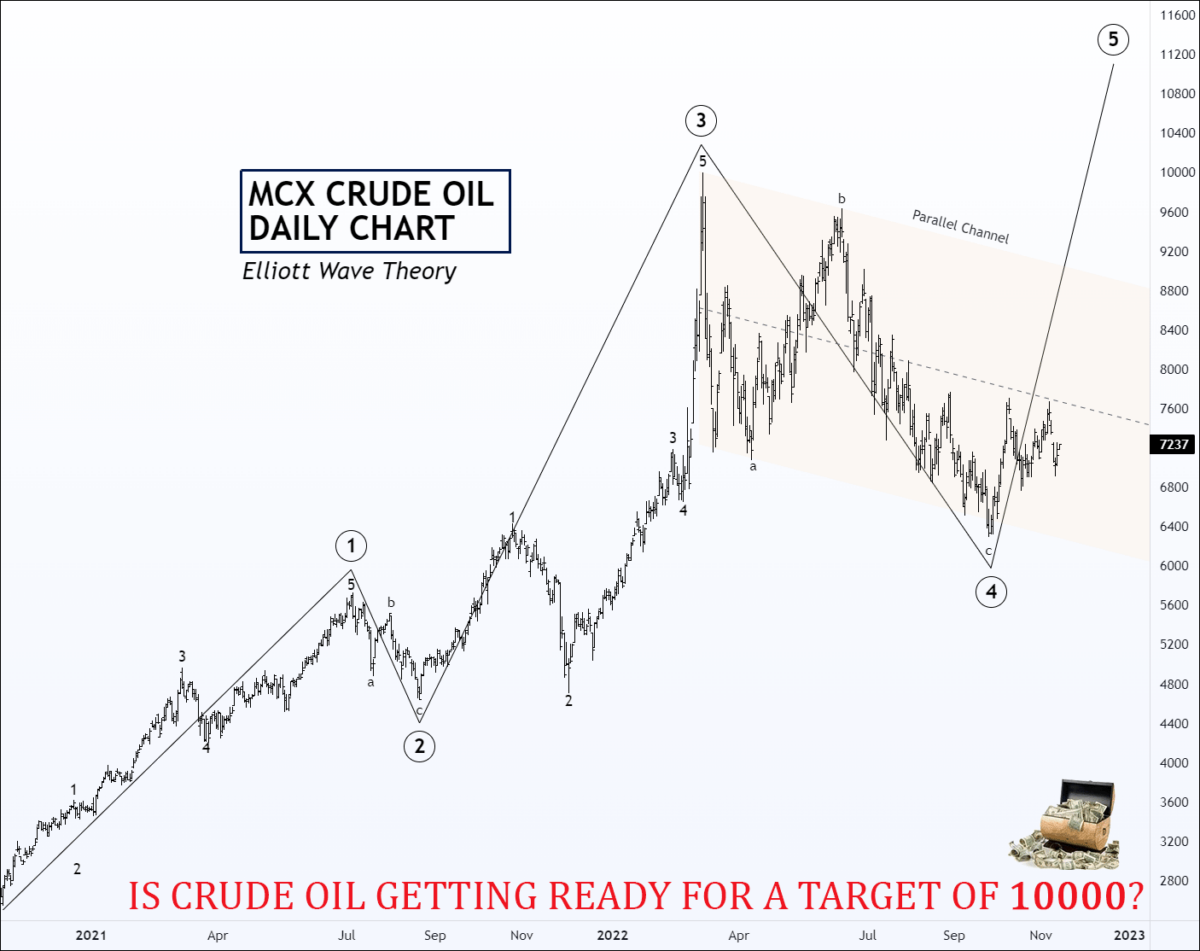
Crude Oil Elliott Wave Cycles Point More Upside
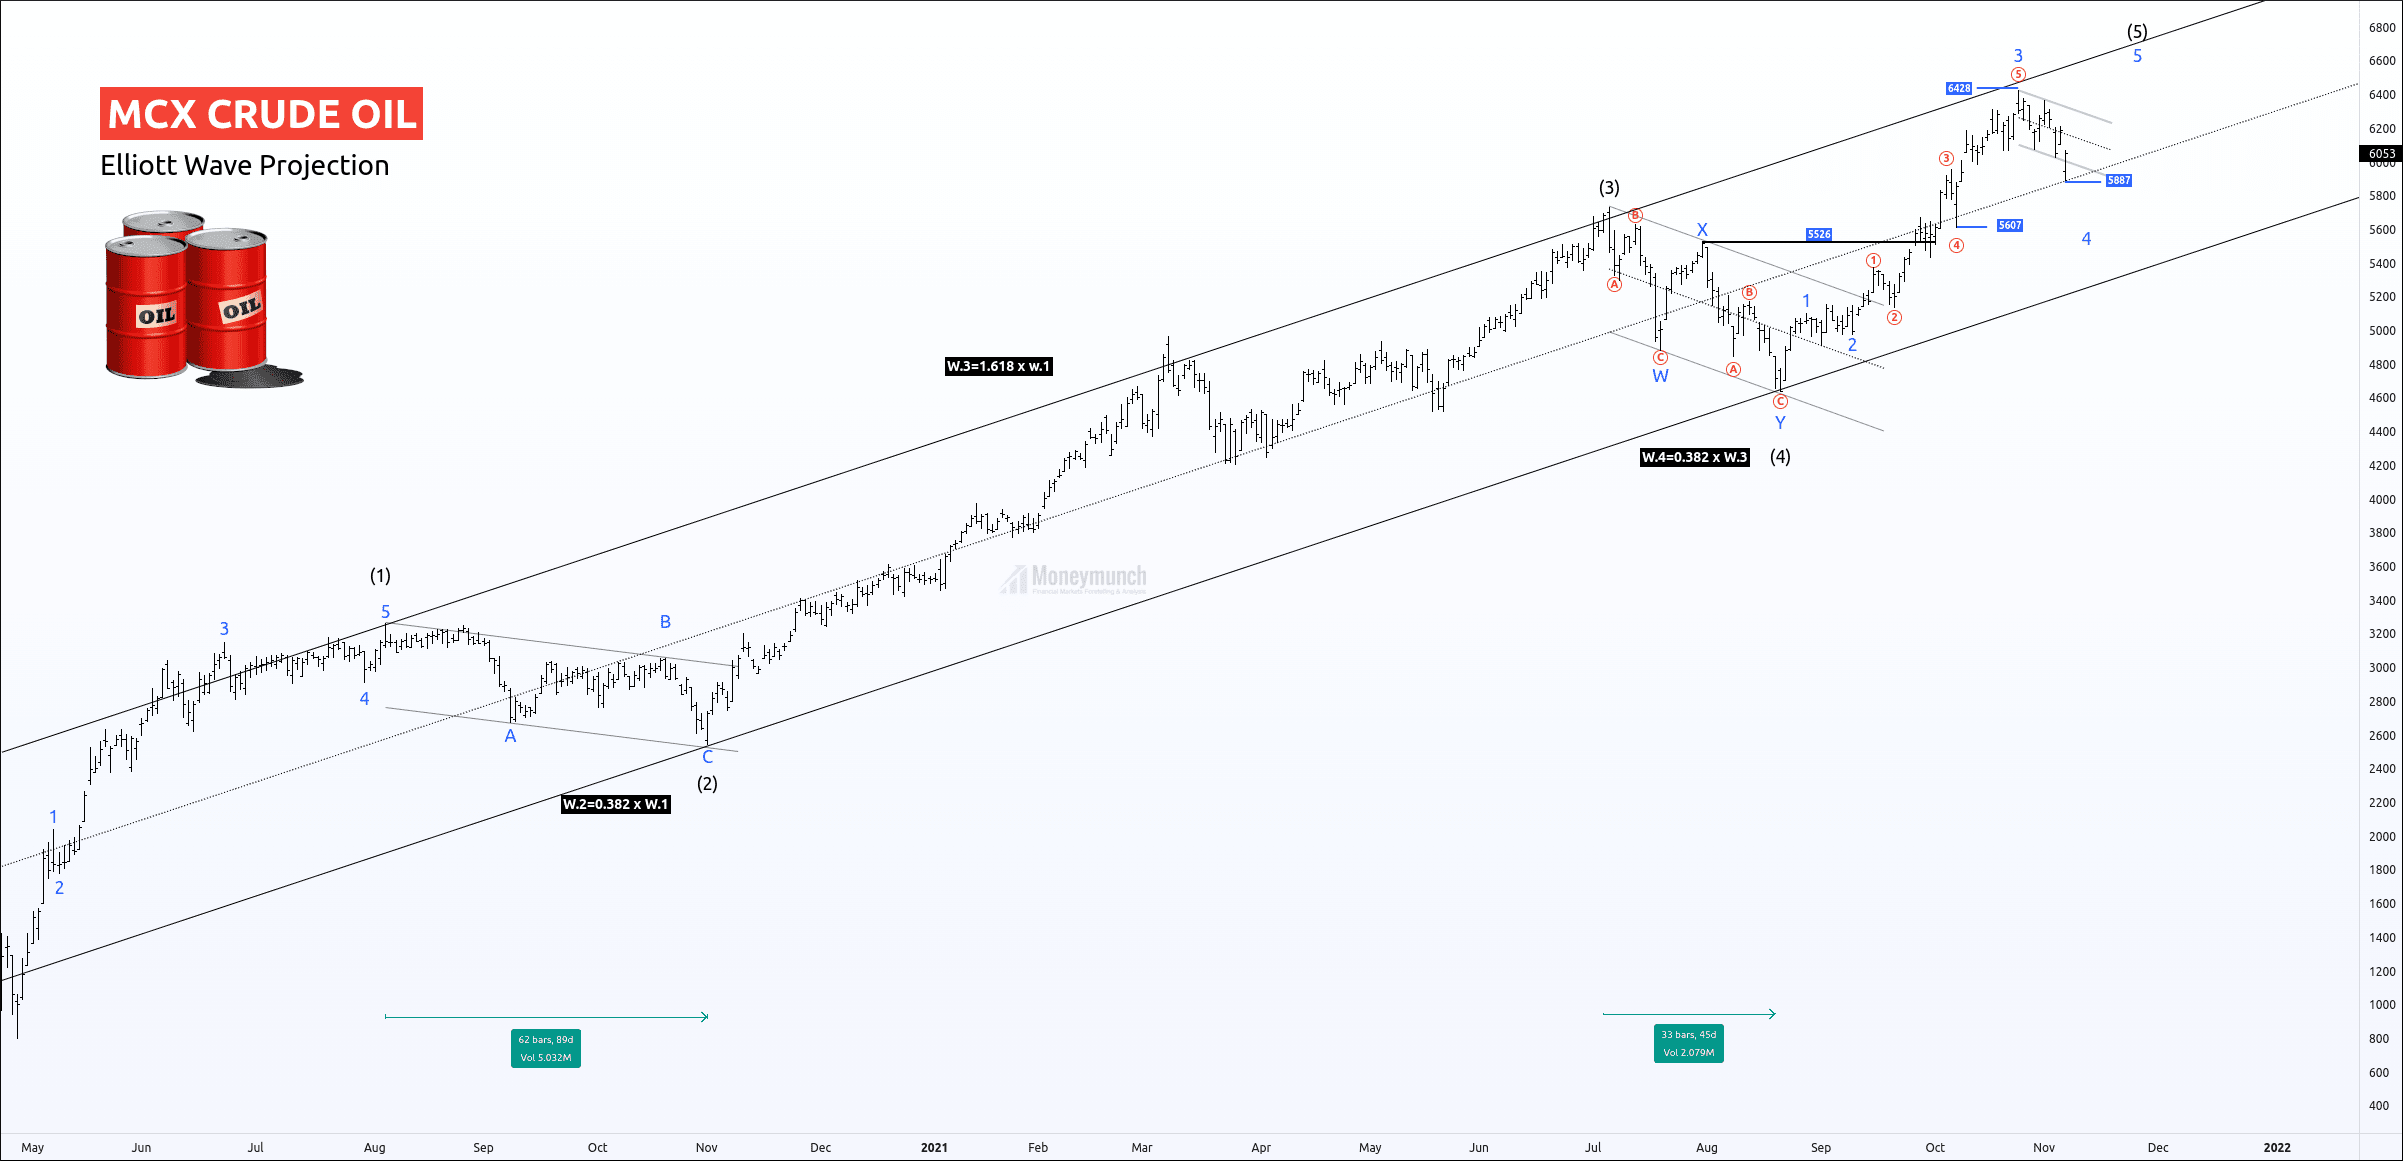
Price had made an extreme low at 795 on 20 Apr ’20.
It had started a quick recovery after an inviolable bottom-out. Due to bearish sentiments and no evidence of the verified bottom, it had constructed 2nd wave correction. The second wave retraced 38.2% of wave 1, which indicates a sturdy bull trend is ahead!
The acceleration phase lasted for 246 days and, the Fibonacci extension of wave 3 was 161.8% of the wave.
The public participation increased when the price had broken up the high of the first wave. It has the signal for bulls that crude was likely to make a new high.
After the acceleration phase, the price has corrected the bull phase with a double zigzag. It had retraced 38.2% of wave 3.
This correction was sharp in comparison with 2nd wave.
According to the above chart,
Wave 2 has taken 89 trading sessions to correct wave 1.
Wave 4 has taken 45 trading sessions to correct wave 3.
Wave 4 was a surprising disappointment for the bull traders.
Here, wave 3 is not a power extended because it hadn’t moved across wave 1.618% of wave 1.
According to the Elliott wave principle, commodities are more often extending at the 5th wave.
Currently, the price has made a new high of 6428.
Price has entered the corrective phase.
It is constructing the 4th sub-wave of the impulsive wave ((5)).
There are two possibilities,
1. If the price breaks the parallel channel, we can expect 50% to 61.8% retracement for wave 4. Be aware of the fake breakout!
Remember, entry is also not possible without an exact reversal signal.
Caution: Wave 4 can never overlap the starting point of wave 1.
2. Price is on the control line of the base channel.
The safe trader can enter the buying position when price breaks the wave B.
To become a subscriber, subscribe to our free newsletter services. Our service is free for all.
Continue reading
MCX Gold & Crude Oil: Downside Risk?
Update 2: Gold Price Slowly Going Upside
Did you read the previous report of MCX Gold? If not, click the below link to read it.
Unlocking The Next Targets of MCX Gold, Crude oil, & Aluminium
I had written, “Key levels: 48113 – 47616
MCX gold has been moving under the range of 48113 – 47616. It’s a very crucial point. We may see a continued uptrend ahead if it breaks and close above 0.382 retracement level. That can be up to 48260 – 48490 – 48600 – 48700“.
Gold has taken a reversal after hitting the first target. Do you think it will go upside from here? To become a subscriber, subscribe to our free newsletter services. Our service is free for all.
 Unlock This Article
Only subscribers can read the full article. Please login to read the entire article.
Update: Beware, Crude Oil Bulls – That’s the Beginning of the End

First, click the below link and read the full crude oil report.
Unlocking The Next Targets of MCX Gold, Crude oil, & Aluminium
Here I had written in clear words, “Crude oil may keep running upward for the levels of 6360 – 6500+. To maintain an uptrend, it has to crossover the hurdle level of 6290 by closing above”.
It has touched the first target and bounced off to entry-level again. MCX crude oil will keep moving forward until kick at the last TP.
To become a subscriber, subscribe to our free newsletter services. Our service is free for all.
Continue reading
Unlocking The Next Targets of MCX Gold, Crude oil, & Aluminium
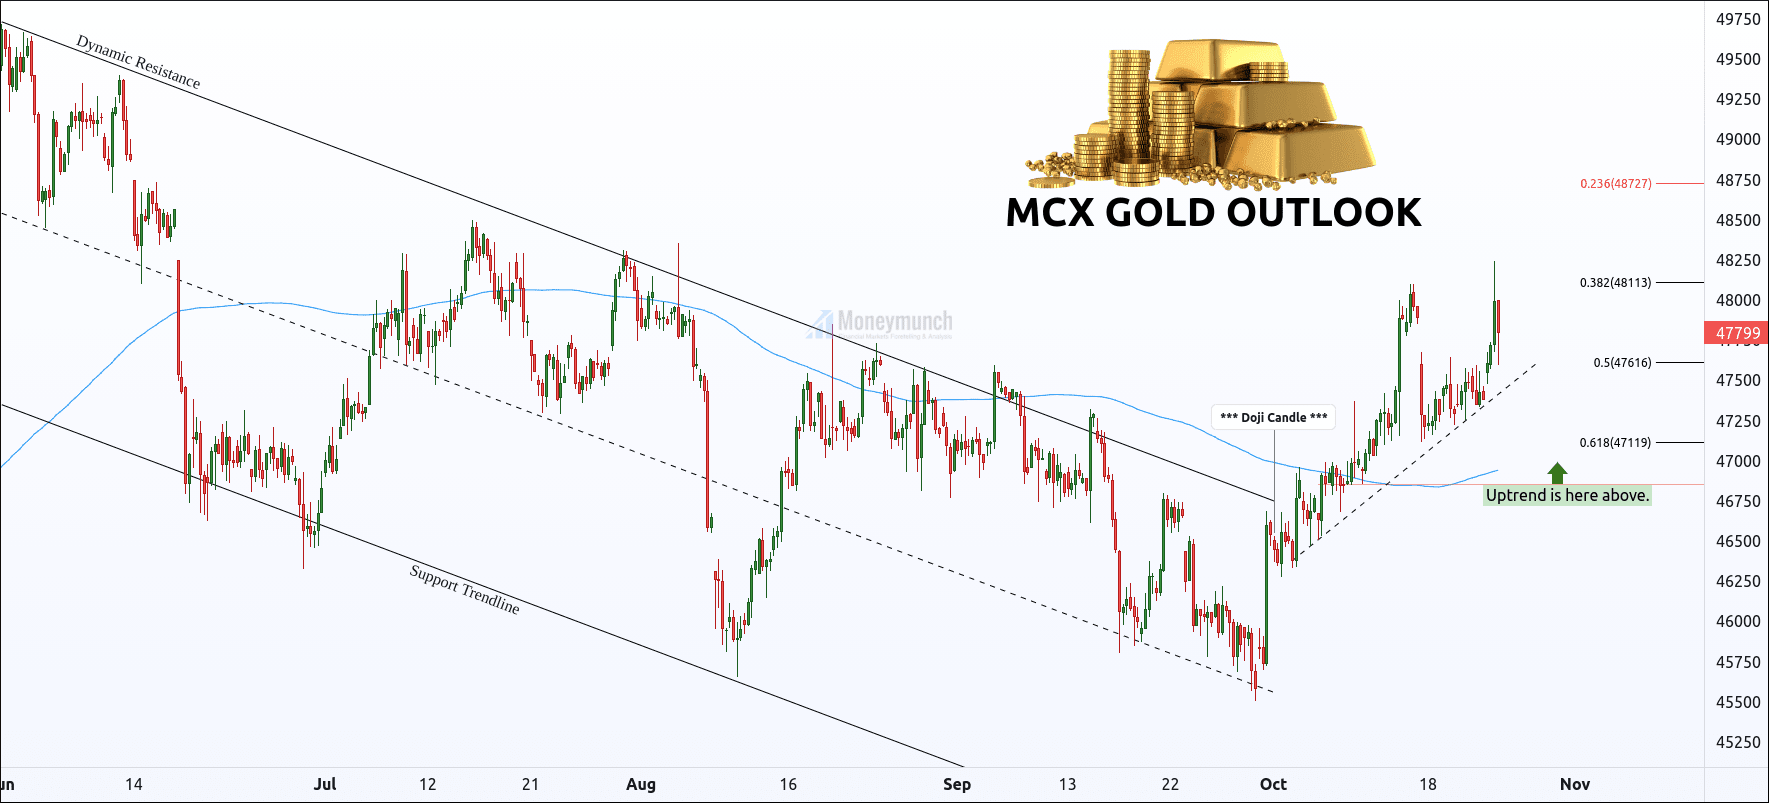
Gold Price Slowly Going Upside
Key levels: 48113 – 47616
MCX gold has been moving under the range of 48113 – 47616. It’s a very crucial point. We may see a continued uptrend ahead if it breaks and close above 0.382 retracement level. That can be up to 48260 – 48490 – 48600 – 48700.
And if it breaks down the 0.5 retracement level, then we may see 47496 – 47300 – 47160.
Kindly note, 47616 is strong support.
Beware, Crude Oil Bulls – That’s the Beginning of the End
 Barrier: 6290 level
Crude oil may keep running upward for the levels of 6360 – 6500+. To maintain an uptrend, it has to crossover the hurdle level of 6290 by closing above.
And if it breaks the level of 6060, then wait for my update.
Aluminium Is Going To Test Critical Technical Support Levels
MCX Aluminium is coming back to the strong support of 226.6. Be ready to jump on it.
To become a subscriber, subscribe to our free newsletter services. Our service is free for all.
Continue reading