
Timeframe: Daily
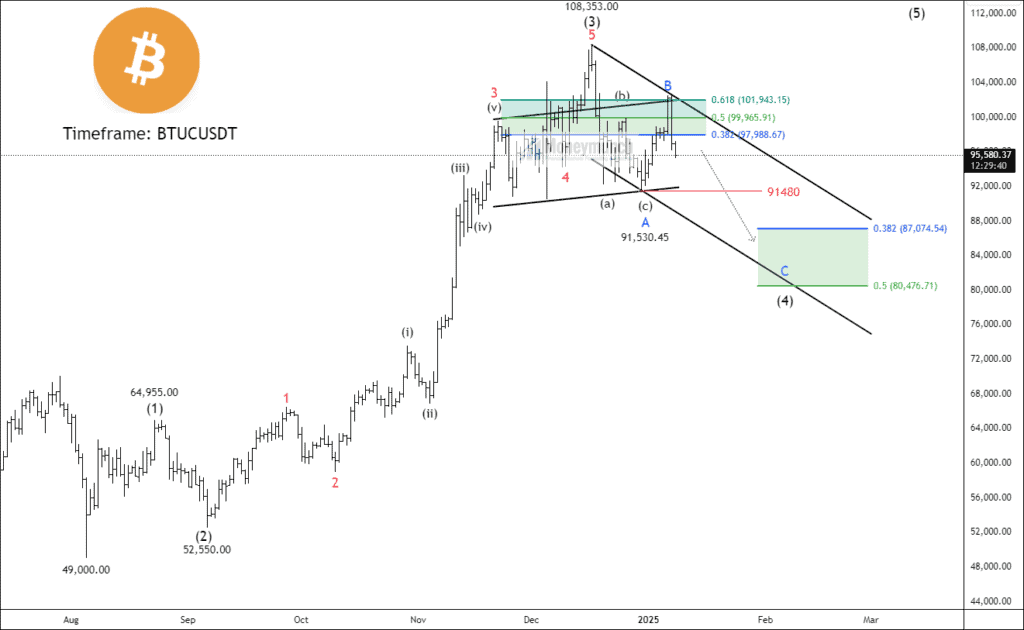
After reaching an all-time high (ATH) of 108,353, BTC/USD appears poised for a retracement. Following the ATH, the price experienced a decline of 15.8%. This marks the completion of wave 3 at the ATH, with the price now moving towards wave (4). The projected end of wave (4) is near the 0.382 Fibonacci retracement level, around 87,074. Notably, wave B of wave (4) retraced 61.8% of wave A. A breakdown of wave A would signal that the price is entering a corrective phase.
A bullish scenario could emerge after the completion of wave C within wave (4), setting the stage for the start of sub-waves within wave (5). Traders should note that buyer pressure remains subdued unless a breakout of the channel occurs. It’s important to remember that only impulsive waves have the potential to break the channel and signal a significant move.
We will update further information for premium subscribers soon.
Get free forex & currency ideas, chart setups, and analysis for the upcoming session: Forex Signals →
Want to get premium trading alerts on GBPUSD, EURUSD, USDINR, XAUUSD, etc., and unlimited access to Moneymunch? Join today and start potentially multiplying your net worth: Premium Forex Signals
Premium features: daily updates, full access to the Moneymunch #1 Rank List, Research Reports, Premium screens, and much more. You΄ll quickly identify which commodities to buy, which to sell, and target today΄s hottest industries.
Have you any questions/feedback about this article? Please leave your queries in the comment box for answers.
Thank you for your insight. Please keep us posted.
You can see from this the cycle top will be a lot lower. Circa 120k area.
Nice work! Thank you for sharing
Bear trap at its finest 👍💰
BTC will be 200$ soon.
thats interesting…