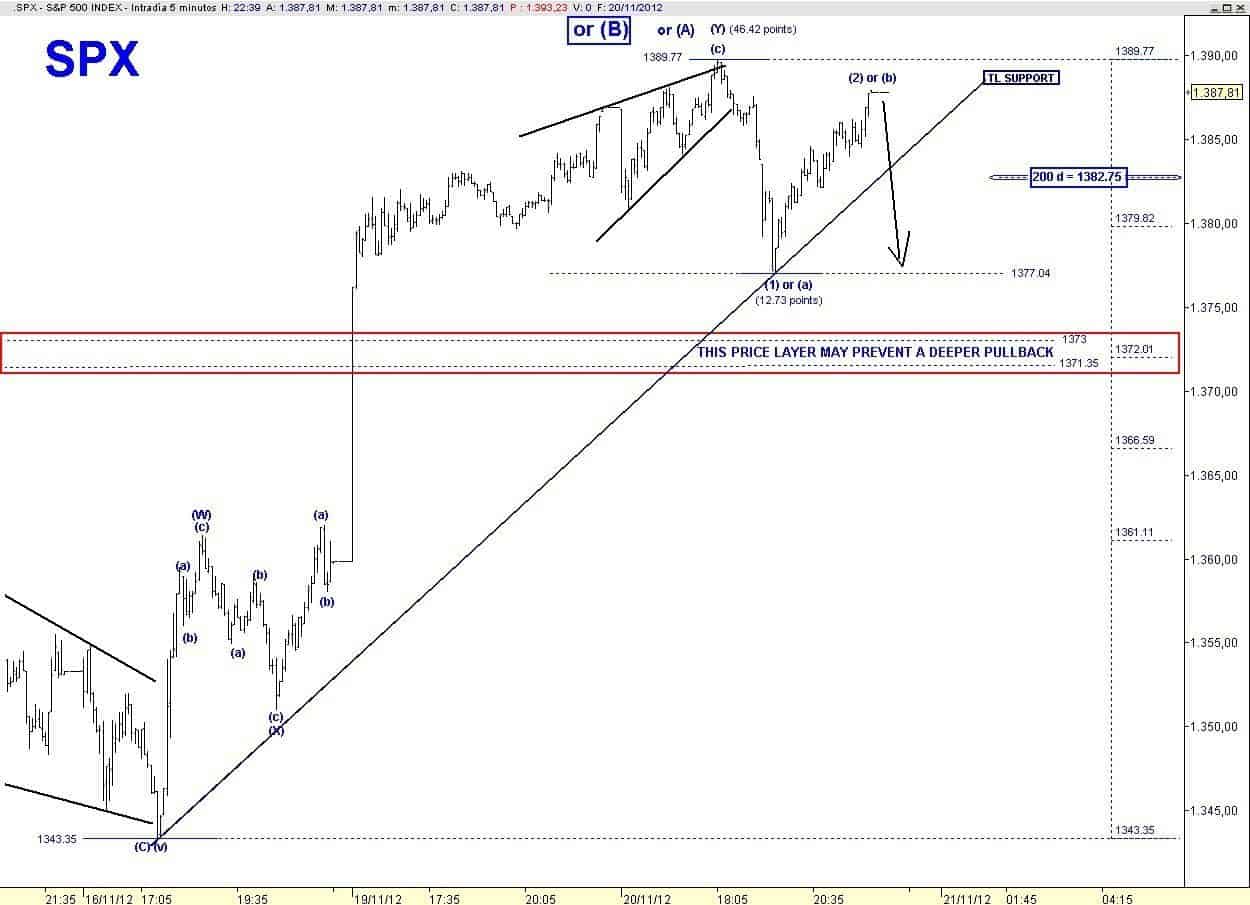
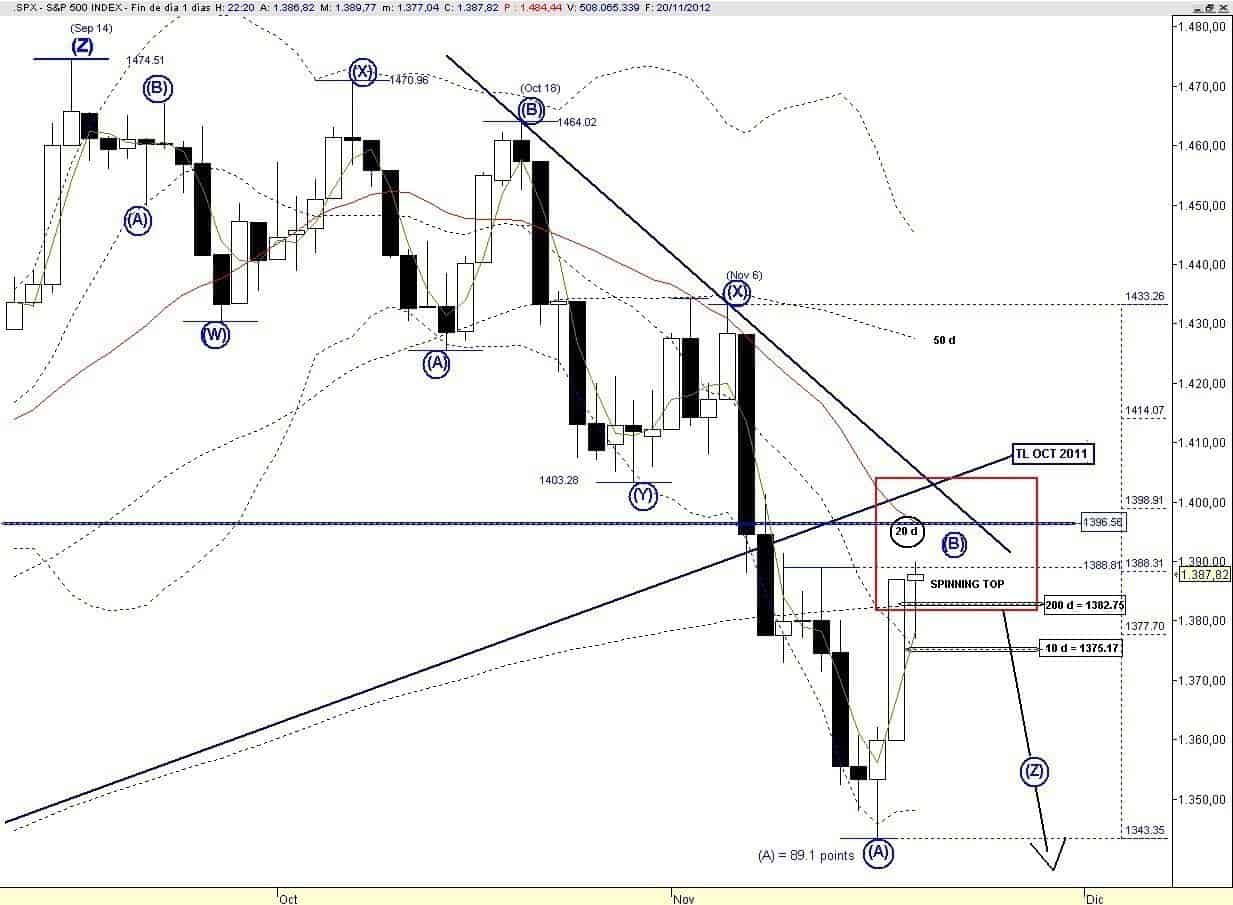
Yesterday SPX fulfilled the script of a narrow range body, it’s the common candlestick (in this case a bearish Hanging Man) that usually follows a white Marubozu. It means consolidation of the previous gains and hesitation.
This pattern could evolve into a bearish reversal pattern ” Evening Doji Star” if today we get a gap down and go. But this is not my preferred scenario.
Regarding the overall count from the September 14 high, I don’t even change a comma, since I remain firmly confident that the current “countertrend” rebound will top in the target box that I have been highlighting in the last few days. Critical overhead resistance is now not far away, either 1397 or a kiss back at the previous trend line support off the October 2011 now converted into resistance.
Once/if price confirms my preferred scenario the last wave (C) down, which could match the length (89.1 points) of the previous down leg; wave (A), is expected to complete the EWP off the September 14 high, hopefully with positive divergences.
For the short term the 10 d mas = 1375.17 could be the demarcation between a mild pullback and something more bearish.
Regarding the labelling of the current rebound so far we have a 3-wave up leg or a corrective variant (DZZ) therefore we have 3 options:
- The “oversold” bounce is over ==> the wave (B) is done.
- Price has established the wave (Y) of a larger Double ZZ.
- Price has established the wave (A) of a larger Zig Zag.
So we need to see the internal structure of a pullback in order to increase the confidence on a count.
For the immediate time frame yesterday’s down leg after completing an Ending Diagonal suggests that there should be at least one more down leg.

As I mentioned yesterday I am watching:
1. EUR: “Since in my opinion the internal structure of the rebound off the November 13 lod is clearly suggesting that in the near future price has more business to the down side. So far bulls here are struggling to reclaim the 200 d ma, which coincides also with a strong horizontal resistance, while slightly above there is the steep declining 20 d ma. Barring “good news”, with the current weak structure, which could be shaping a bearish Flag, price should reverse in the range of the Trend line resistance in force since the October 17 high and the next horizontal resistance at 1.2876″.
So far price is maintaining the sequence of higher lows hence if price breaks above 1.2840 (trend line resistance off the October 17 high) then within the corrective pattern in progress price could extend the move towards the next resistance located at 1.2876.
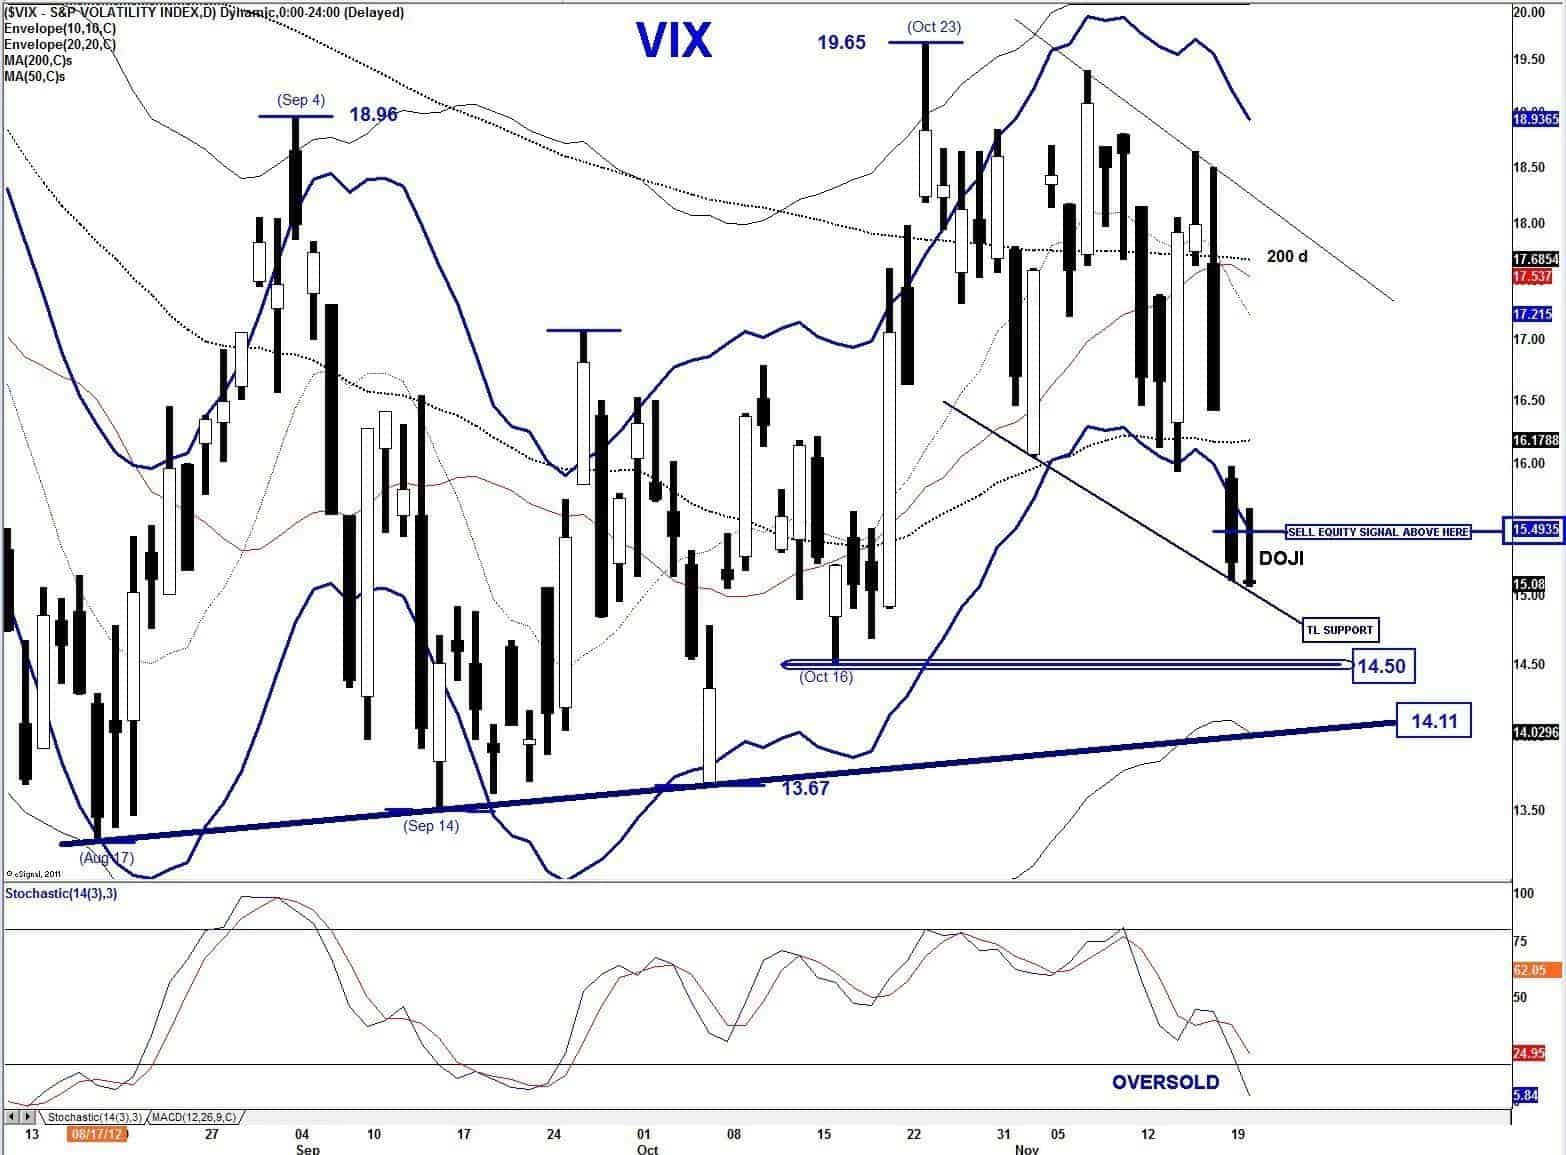
2. VIX: we now have to watch the trend line support and the possible “sell equity signal” that would be issued with en eod print above the Bollinger Band of the Envelope > 15.50.
Yesterday’s doji + oversold Stochastic are favouring at least a bounce attempt, although ahead of Thanksgiving holiday it may not be a reliable indicator.
I wish a wonderful Thanksgiving to US readers.
Get free forex & currency ideas, chart setups, and analysis for the upcoming session: Forex Signals →
Want to get premium trading alerts on GBPUSD, EURUSD, USDINR, XAUUSD, etc., and unlimited access to Moneymunch? Join today and start potentially multiplying your net worth: Premium Forex Signals
Premium features: daily updates, full access to the Moneymunch #1 Rank List, Research Reports, Premium screens, and much more. You΄ll quickly identify which commodities to buy, which to sell, and target today΄s hottest industries.
Have you any questions/feedback about this article? Please leave your queries in the comment box for answers.


