This stock can fill your packet.
(Piramal Enterprises Ltd)

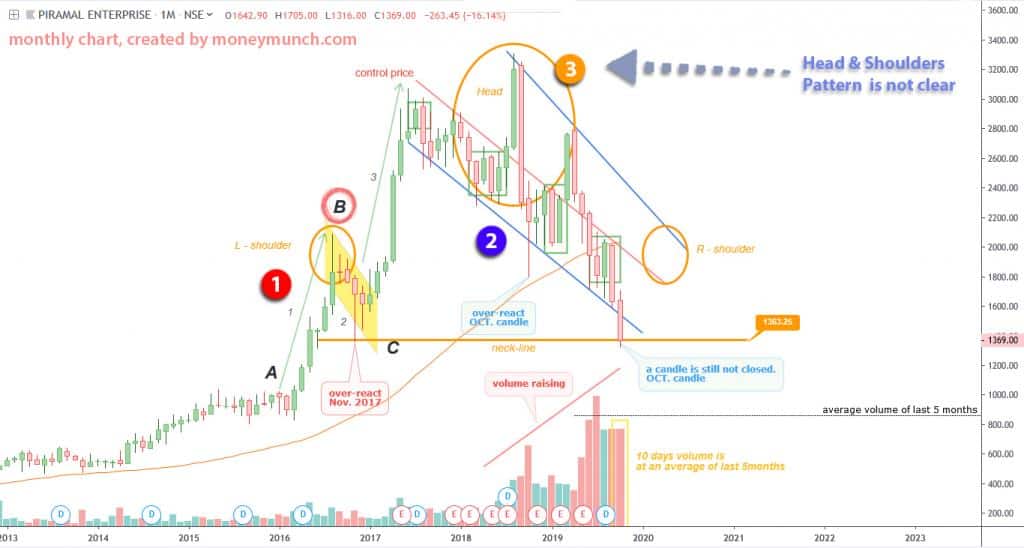
- Flag Pattern
- Unclear Head and shoulders pattern (Price is trading at neckline)
- Channel with control price
Cycling Observation:
For Oct. 2017, Over-Reaction observed in Nov and Dec 2017.
The month of Oct and 2018 have been seen Over-reaction with the change of the Volume.
Currently the Oct 2019, a price is out of the channel, and it has been just 10 days of this month.
A sharp look at Volume:
Volume for the last 10 days is equal to the Average Volume of the last 5 months.
There are still 20 days left until the end of the month of Oct, even though the 10 days volume and price is outside the channel. This is the clear sign of TAIL before ending this month.
Question is, Why the price is outside the downtrend channel?
-> Before the answer this question, you must understand the sentiment of the investors. If we talk technically, price breaking 50 days M.A. the fear of spreading within the investors. Informed and Uninformed both investors having fear but Pro Investors will take action when price over-react.

If you have little knowledge of technical analysis, then you can easily understand the above weekly chart of (Piramal Enterprises Ltd).
The daily chart of Oct. 2018

Looking at Oct 2018 and comparing it with Oct 2019, we get an idea of the upcoming movement of this stock. Shortly, We will update for Subscribers this daily chart and 30-min chart for taking action.
To become a subscriber, subscribe to our free newsletter services. Our service is free for all.
Below Call given to Subscribers…!
BUY PEL future OCT 1335-45 targets is 1445-1500
Get free important share market ideas on stocks & nifty tips chart setups, analysis for the upcoming session, and more by joining the below link: Stock Tips
Have you any questions/feedback about this article? Please leave your queries in the comment box for answers.
Send mcx positional calls and technical analysis every weak. Thanks