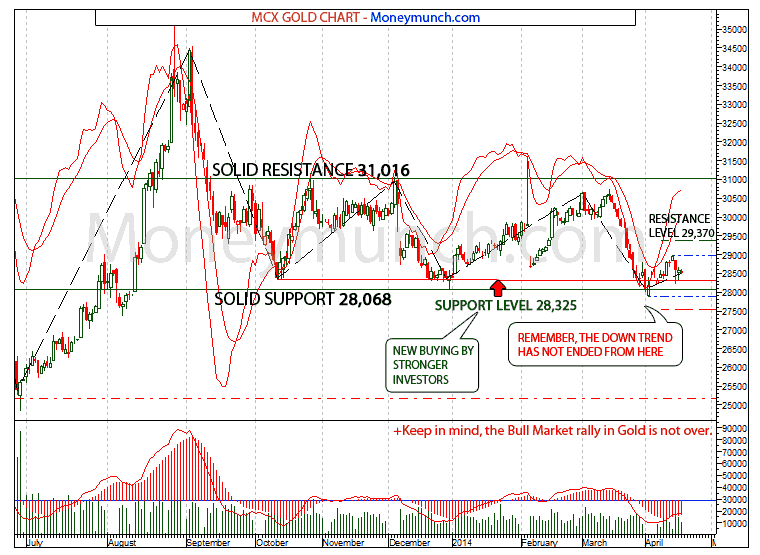
Look above MCX Gold chart, you can find – It’s presently playing between support level 28,068 and resistance level 31,016. Gold has lost all its April gains with closing at 28,505(-84). It will turn into positive if close over my resistance level 29,370 otherwise carry on drop downwardly. By investigation, we found fresh buying by stronger hands at support level 28,325.
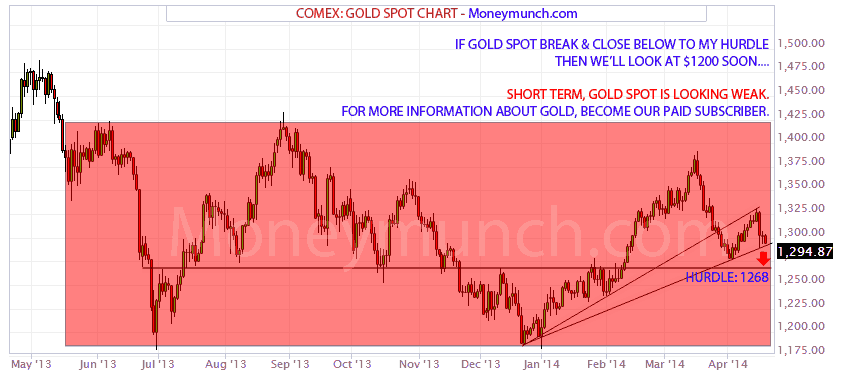
This week, if gold run around our support level 28,325 and close below then sell on rise with targets: 28,070-27,960-27,880 below. As well as Gold spot is looking weaker rather than MCX Gold, look below chart:
For intraday / positional, when it will become 100% positive? I will inform to my subscribers only! To become a subscriber, subscribe to our free newsletter services. Our service is free for all.
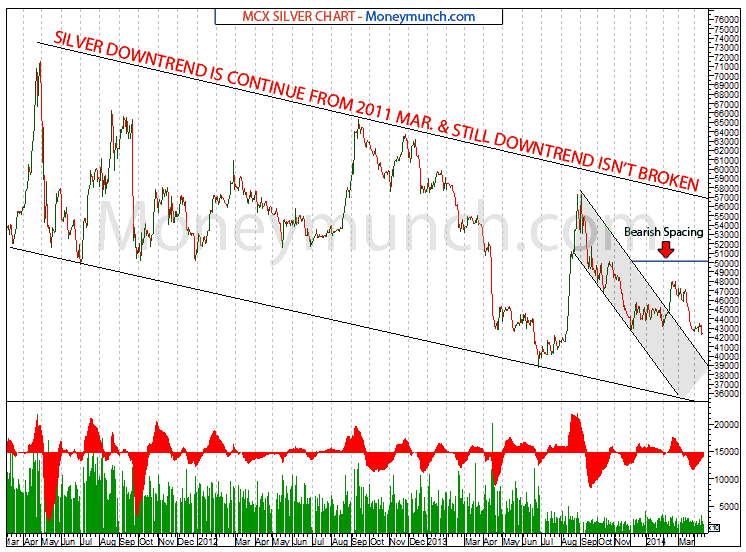
Stare up on MCX silver chart, if it close above ‘Bearish Spacing’ level 50,585 then we will see Mega-Buying (55K+) otherwise for short-term silver needs one more decline. Silver will kiss levels 41,000-40,000 in coming day. Hurdle for short-term traders: 43,040.
Try to sell on rise, if close above hurdle for 1-2 consecutive days then discontinue selling furthermore start buying for 44K-45K.
Now everything depend on you, how you build Monday first smart trade on Gold / Silver. Yes, I will continue update and also for intraday trading for subscribers!
Get free MCX ideas, chart setups, and analysis for the upcoming session: Commodity Tips →
Have you any questions/feedback about this article? Please leave your queries in the comment box for answers.


best best commodity tips ever for all the investors in this field. Best commodity tips only moneymunch can provide!
– M K Rathod
(Your client)