How to trade using RSI Indicator a tool?

RSI-relative strength index

   “Inventor-j.welles wilder,jr, invented in 1978”

What is Relative Strength Index (RSI)?

Relative Strength Index (RSI) is a momentum oscillator, Measuring the velocity and magnitude of direction of price movements. Momentum is the rate of the rise or fall price in RSI. It is used in computer momentum. The relative strength index was developed by j. Wellles Wilder and published in a 1978 book.

Bifurcation:

Bearish divergence occurs when price makes a new high but the RSI makes a lower high, thus failing to confirm. Bullish divergence occurs when price makes a new low but RSI makes a higher low.

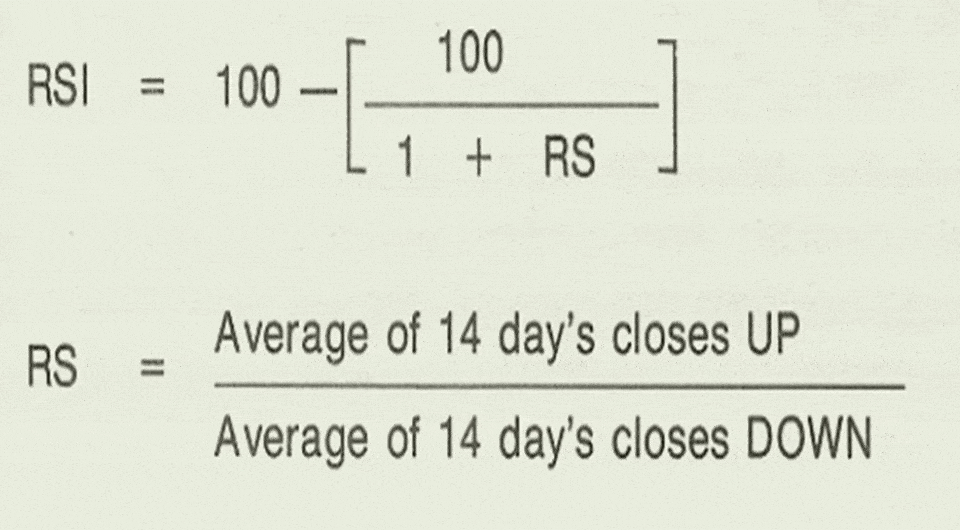
How to calculate RSI? 

The smoothed moving averages should be appropriately initialized with a simple moving average.

How does RSI help in trading? 
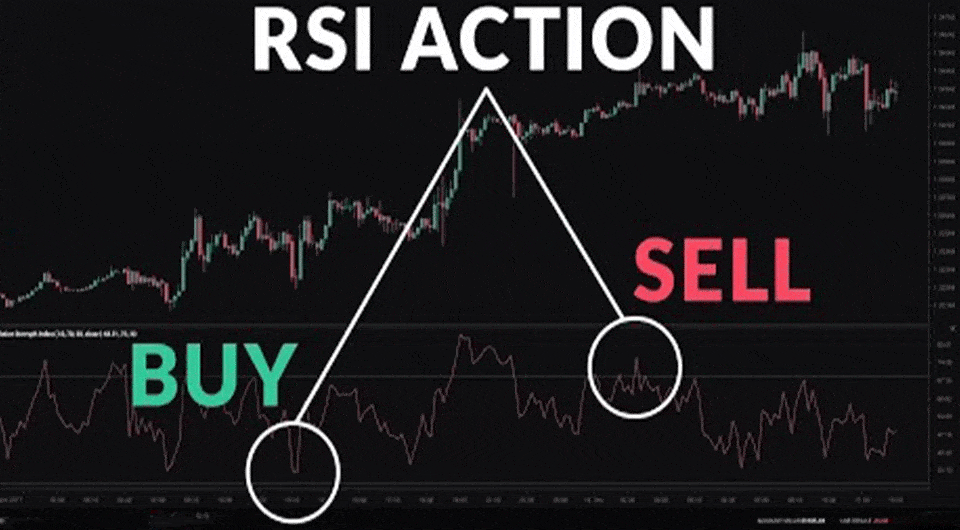
The price oscillates between 0 and 100, traditionally the RSI is considered overbought when above 70 and over sold when below 30.

  When indicators start going above 70, then it’s called the market overbought, and it signals for the sell.

   When indicators start going below 30 , then it’s called the market oversold, and it’s a signal for buy.

Uptrend and downtrends:
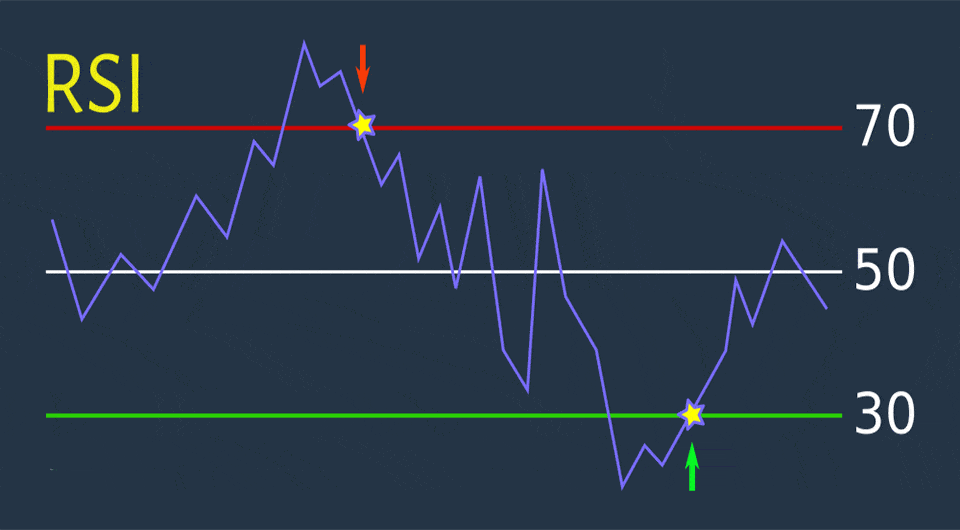
(1)RSI Bullish-indicators survive in the range of 50-100.

(2)RSI bearish-indicators survive in the range of 0-50.

(3)RSI sideways-when indicators survive around 50,minor momentum

  Indicators pattern-double top and bottom double:
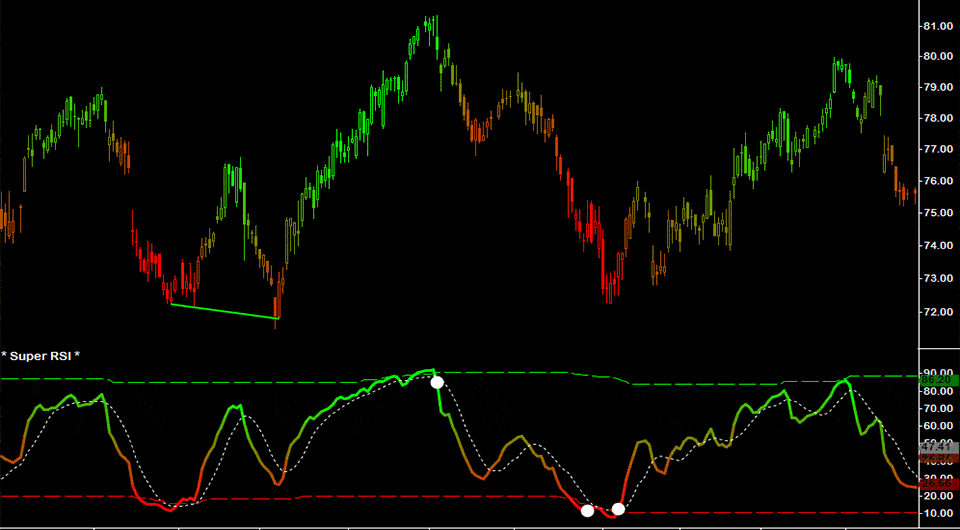
Whenever an indicator creates a double top in the range of 70-100,then is the signal of strong reversal.

Whenever an indicator creates a double bottom in the range of 0-30,then is the signal of a strong reversal.

Continue reading

Dealing with 4-chart “extensively research” at Reliance price

  Volume vs. Price Action:

Points to be focus on:

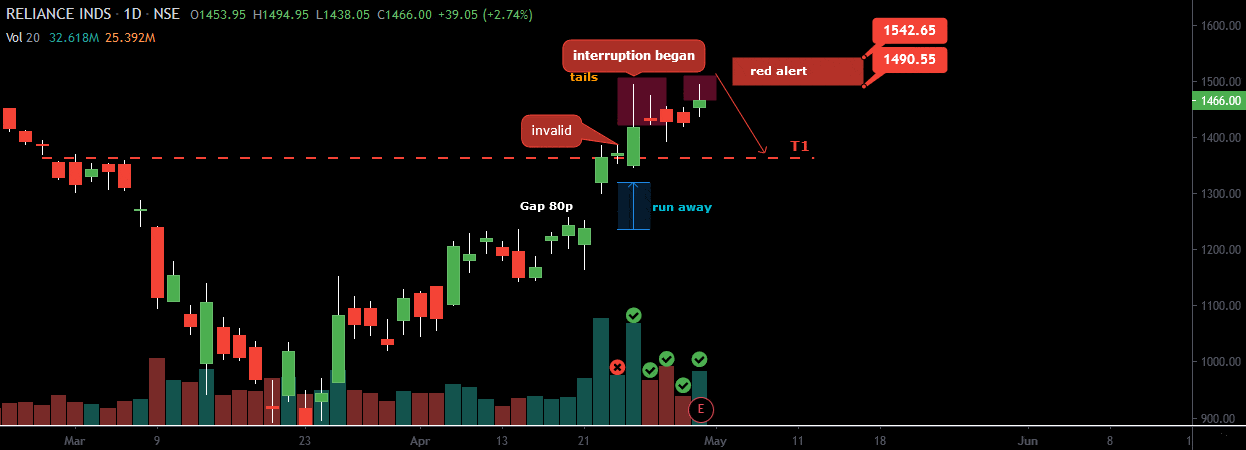
  • Gap (run away type)
  • Invalid Doji (from the left to right Doji is invalid because of low volume compare to previous candle)
  • sequence of tails (sign of existence negativeness)
  • Interruption began to push price upward.

Red Alert : sellers will take action on the Red Alert zone 1542 to 1490, and price will T1 as target.

To become a subscriber, subscribe to our free newsletter services. Our service is free for all.

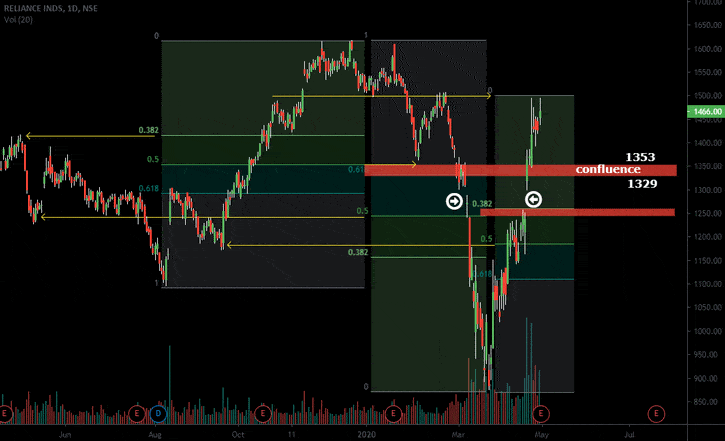
Fibonacci Retracement:

Confluence zone 1353 to 1329 target
next target 1250 nearby if sellers will continue.

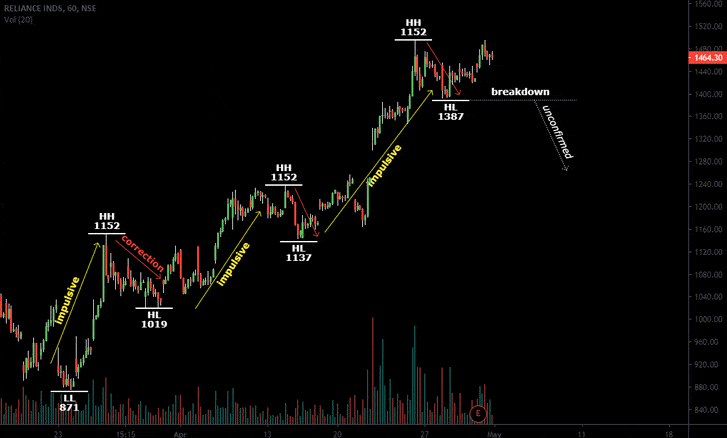
Wave analysis theory (unconfirmed):

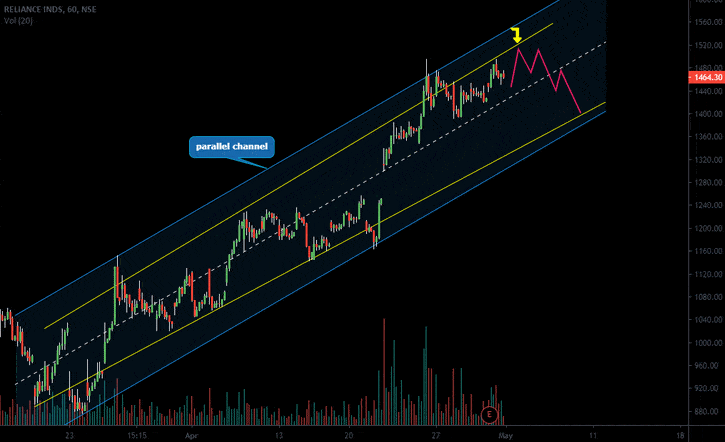
Parallel Channel and Project:

T1 -1375 to 1380

Continue reading

Where To Sell BANKNIFTY?

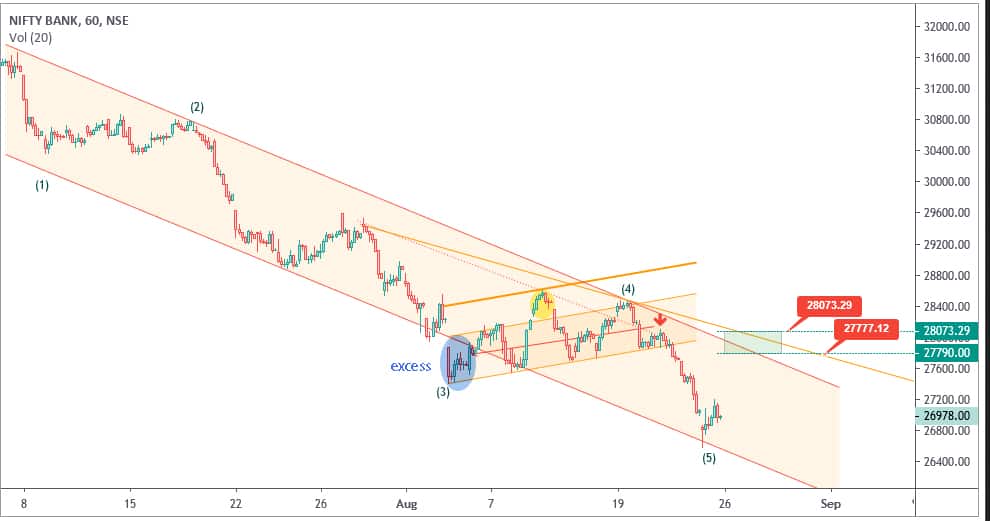
Banknifty resistance starting from 27777 to 28073 as per channel.
Last update was for paid customers at 27777 for sell which was below (4).


  • Nifty is going to open gap up 78-89 points positive. Expected 110-129 points positive after opening. We have created a sell strategy for NIFTY
  • Wall Street opened lower on Friday.
  • Oil prices fell on Monday.
  • Moody’s Investors Service on Friday cut India’s GDP growth forecast for 2019 calendar year to 6.2
  • percent from the previous estimation of 6.8 percent.


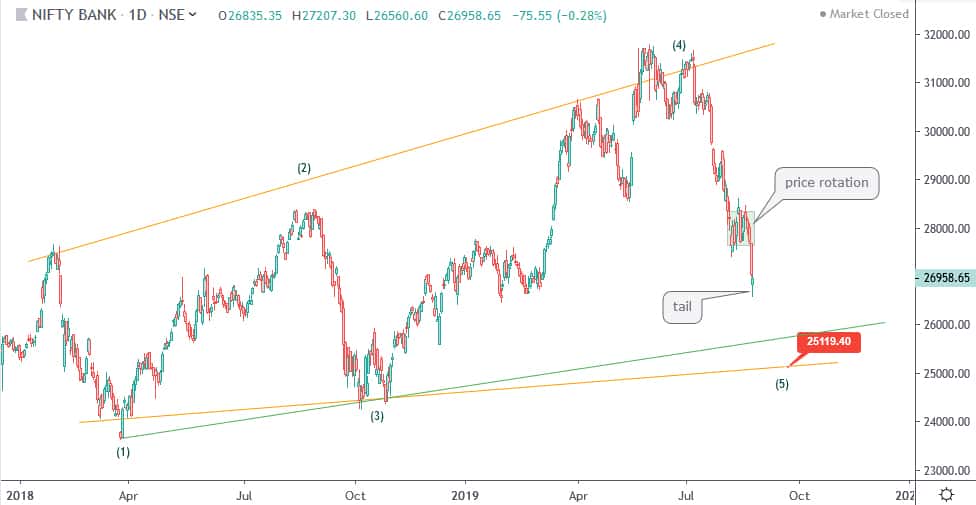
Let’s look at a higher timeframe chart.


As per the daily chart, fall is still left but the question is where to sell?
Detected tail in the last secession.

BANKNIFTY target updated on 2:00 PM 28th, AUG 2019

In the last update written to sell banknifty 28310 nearby but, I did not mention target and told you that will update shortly.

Banknifty made high 28245 and started to fall down.

Target banknifty 27743(trendline support) and breaking / staying below it will be a target at 27605.

To become a subscriber, subscribe to our free newsletter services. Our service is free for all.

Continue reading

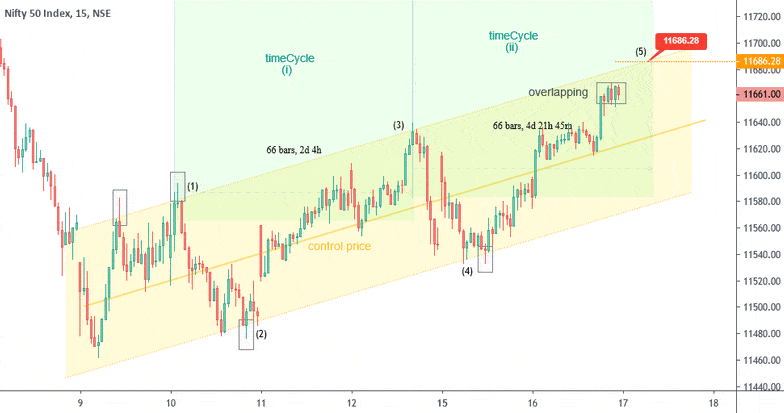
Channel Pattern Closed out for NIFTY?

Pattern CLOSED?
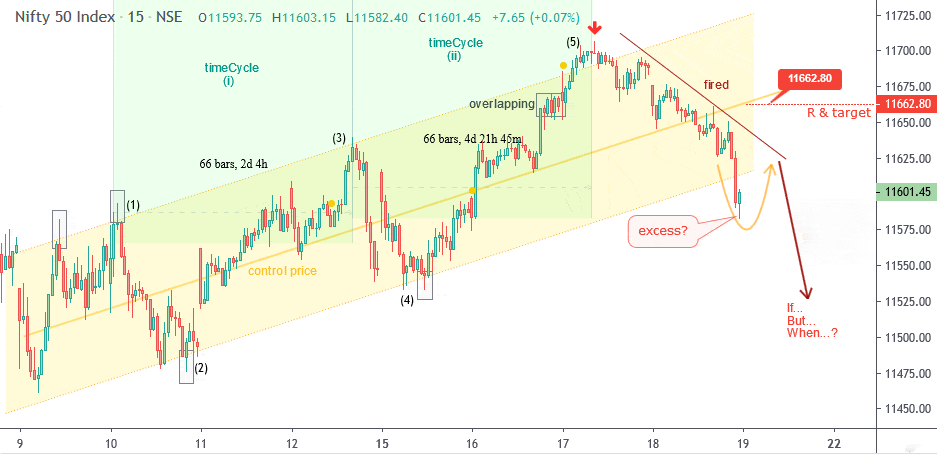
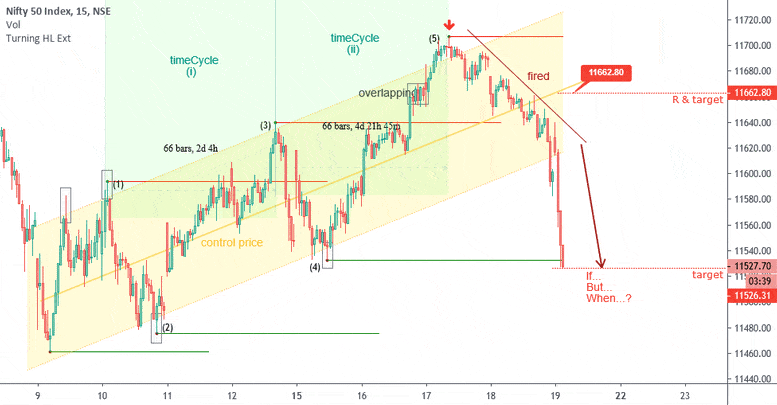
As per our Theory, 5th wave always give you fired move as seen past. You can also check perfection on BANKNIFTY too.

If this is an excess of channel, then target is 11650 nearby and Resistance 11666.

–> Let us remind you.
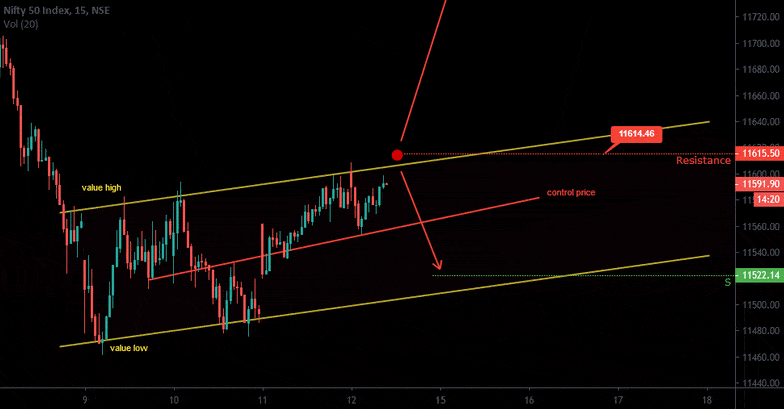
On the date, Jul 12 2019 channel first drawn by us.

Exactly NIFTY was moved to (4) and U-Turn has taken directly to control price.

Jul 15 2019, In the chart it was pointed out (5) wave on this chart.

Finally, (5) wave was printed on the date of Jul 17 2019 and Taken Resistance.

Do you think that IS THE CORRECT visualization?

You can see in this chart today’s NIFTY move, it has exactly followed our words moved exactly to the same things we have mentioned.

Accurately happened what we predicted. Channel Was closed out.

To become a subscriber, subscribe to our free newsletter services. Our service is free for all.

Continue reading

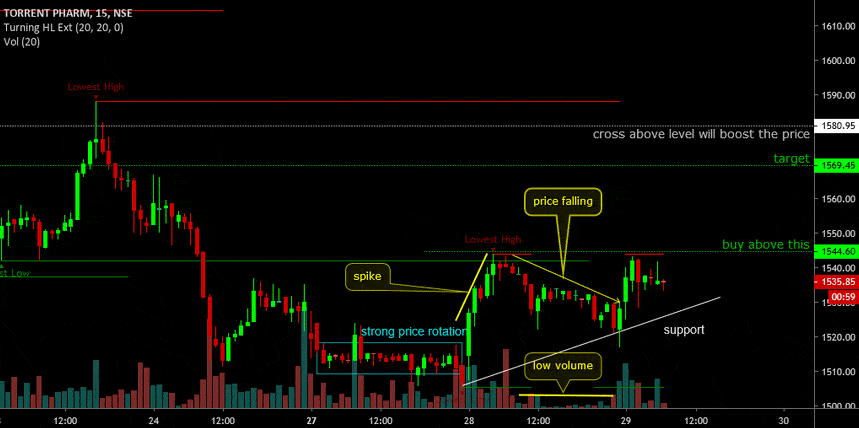
TORRENT PHARM Intraday + Positonal (15min Dips Research)

Due to falling the price, there is very low volume -> (not interested sellers)
After strong price rotation, up spike has been seen -> (buyers wining)

Buy above 1544 is not bad idea VS buying at the dips in support is accurate trade.

This call given to SUBSCRIBERS 29th, May 2019 in last hrs.

BUY TORNTPHARMA EQ stoploss 1508 and buy 1514-1518 and targets 1574

for the more accurate of profit booking level will update soon.

To become a subscriber, subscribe to our free newsletter services. Our service is free for all.

Continue reading

Stop taking long position on TCS…! reason behind it?

  • The left side to the right, each excess, have tails before the turn. You can see with both eyes at excess(f) has started to create TAIL which is -ve for long and indicate for reversal of the trend.
  • With Time Cycle analysis, 1st-phase has 43 bars and 2nd-phase and 3rd phase till continue.
  • Turn on your eye on volume, it’s reducing.

Prev. Resistance is at 2194.5, so seller and profit booking can be seen that time with a TAIL.
Short sellers have two points of target, one Control Price target 2117 nearby and prev. Strong support at 2051.

To become a subscriber, subscribe to our free newsletter services. Our service is free for all.

Continue reading