MCX Gold Will Show 2000 Points Movement Soon

free gold tips chart

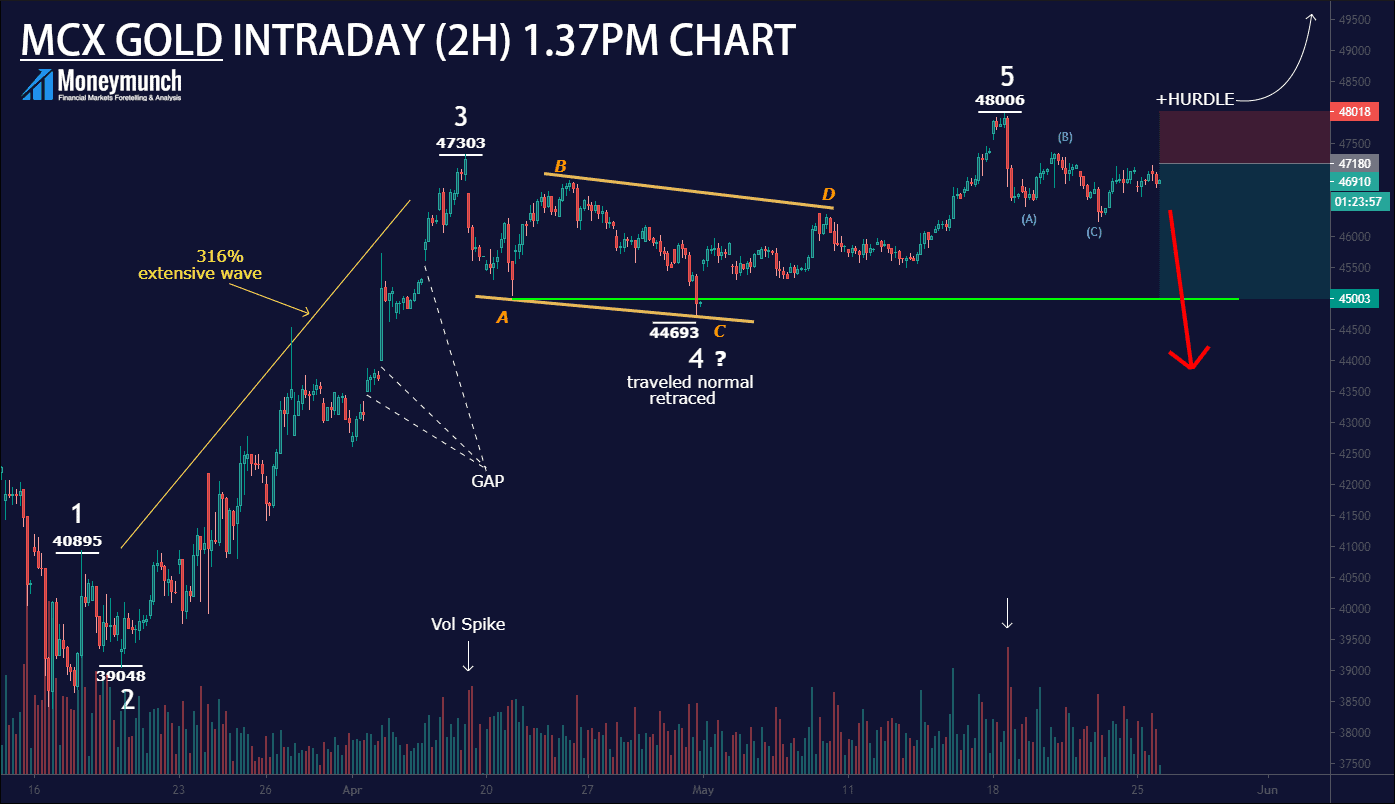
The 3-impulsive Wave was considered extended with 316% of the 1-Wave included numbers of gaps. A, B, C, and D is a parallel channel of the 4-wave. The price was traveled to approx. 38.2 retraced from 3-wave.

The 5-wave minor crossed of 3-wave on the account of extended move seen 3rd wave.

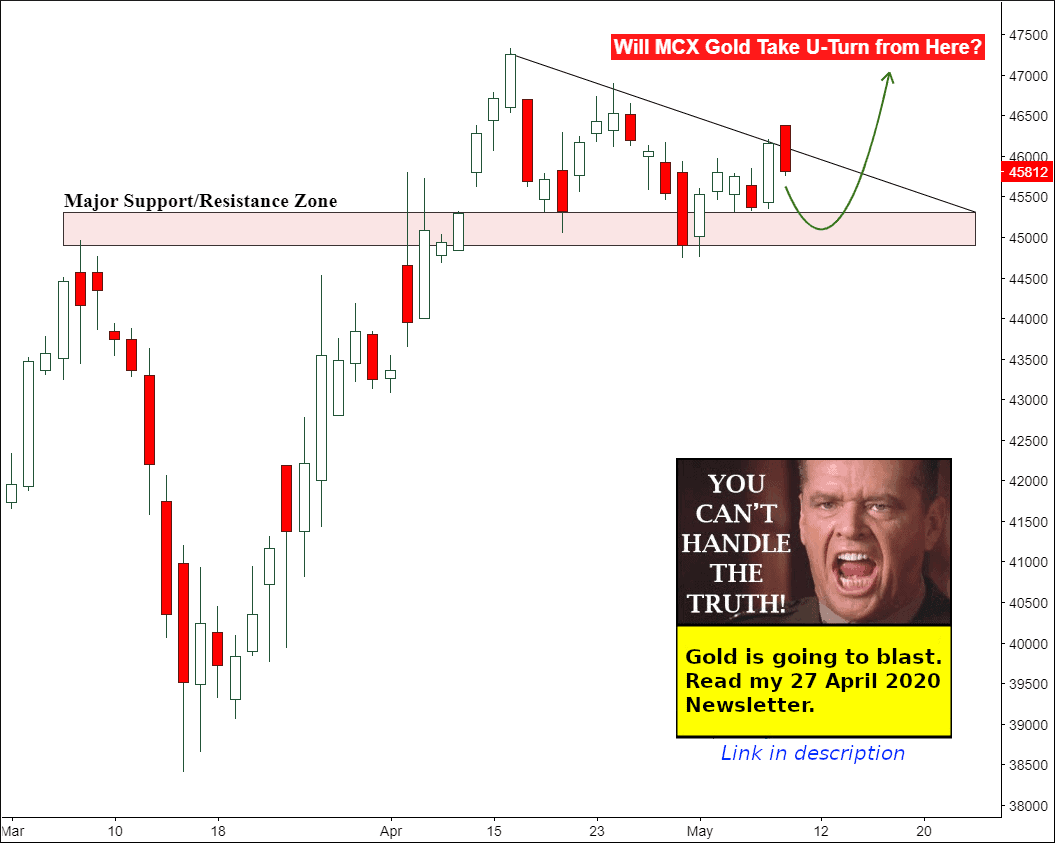
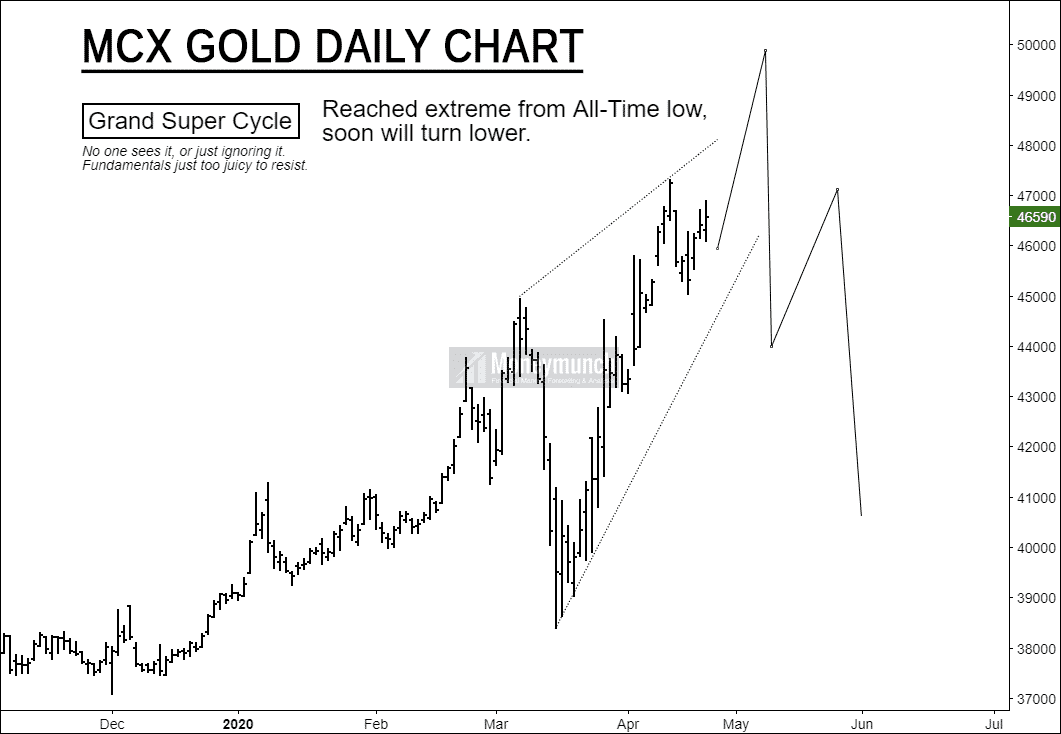
We then came down to the level marked wave 4, but I have put a question mark there. This is because there is a small chance that we are in the middle of a complex correction, and so wave 4 might have finished at the point where I have tentatively placed the number (A) to the right. As far as the investor is concerned, he should have gotten out of this stock at the point marked wave 5 top because that was as high as one could ride his luck in an extended fifth wave. In the not too distant future, we should expect Gold to be dumped and for it to reach the low 41000 levels.

Attention: it can surge for 49000 to 50000 after a breakout of wave fifth top.

Check the previous chart (27 April 2020) to know more.
Link: MCX Gold vs. Crude oil – Tips & Update

…and also refers to the 11 May 2020 article: MCX Gold Long-Term Trend Analysis & Tips (As mentioned, the gold made the final rally and hit 48000. What else you want?)

To become a subscriber, subscribe to our free newsletter services. Our service is free for all.

Continue reading

Cotton, Coriander, & Soybean Trading Tips & Charts

Coriander Price Setting Up For A Upside Price Rotation

free coriander chart calls

Soybean – Moon Rising

NCDEX Soybean futures price is moving higher. As per the current situation and fundamental view, its demand is increasing. It could jump for 4000 – 4160 levels.

Technically, 4200 is a hurdle.
Red zone: 3700 – 4200

MCX Cotton near to Resistance: the Upcoming Move

As per the following chart, the cotton price may hit 15460 – 15200 – 15000 below soon.

mcx cotton tips chart

Don’t forget to keep your eyes on the resistance line.

To become a subscriber, subscribe to our free newsletter services. Our service is free for all.

Continue reading

MCX Gold vs. Crude oil – Tips & Update

gold daily chart tips

Crude Oil Price Is Getting Ready For Its Next Breakout

free crudeoil tips chart

As per the chart and situation, we will see more downside jump in crude oil prices.
Downtrend targets: 800 – 760 – 700 – 600 – 560 below

Traders can stop selling if it closed above the 1600 level or watch out the resistance trendline.

In the next report, we will update on MCX Gold & Silver in-depth.

Guar Gum Sets Up For Another Massive Move Lower

NCDEX Guar Gum Futures is close to March low. It will keep falling if that level breaks.
Targets: 4660 – 4500 – 4400

Note: position can be initiated after a breakout of March low.

Don’t miss out to read the previous agri-commodity trading alerts report: Free Jeera & Cotton Tips

To become a subscriber, subscribe to our free newsletter services. Our service is free for all.

Continue reading

Will Crude Oil Touch 900 Level?

free crudeoil chart tips

This crude oil chart is for intraday traders only.
Sell position can’t initiate after breakout 990 level.

Continuation: 930 – 910

To become a subscriber, subscribe to our free newsletter services. Our service is free for all.

Continue reading

What’s Next for NCDEX Jeera & Cotton Price Trend Forecast

commodity jeera tips chart

Price Range: 5152
Breakout Range: 15600 – 10448
A short reversal started from the 13110 levels.

Short-term Trend Analysis:

MCX Cotton is a sellable script until it remains below 17000 for the target of 15800 – 15000.
Isn’t it enough to know the next move? To become a subscriber, subscribe to our free newsletter services. Our service is free for all.

Continue reading