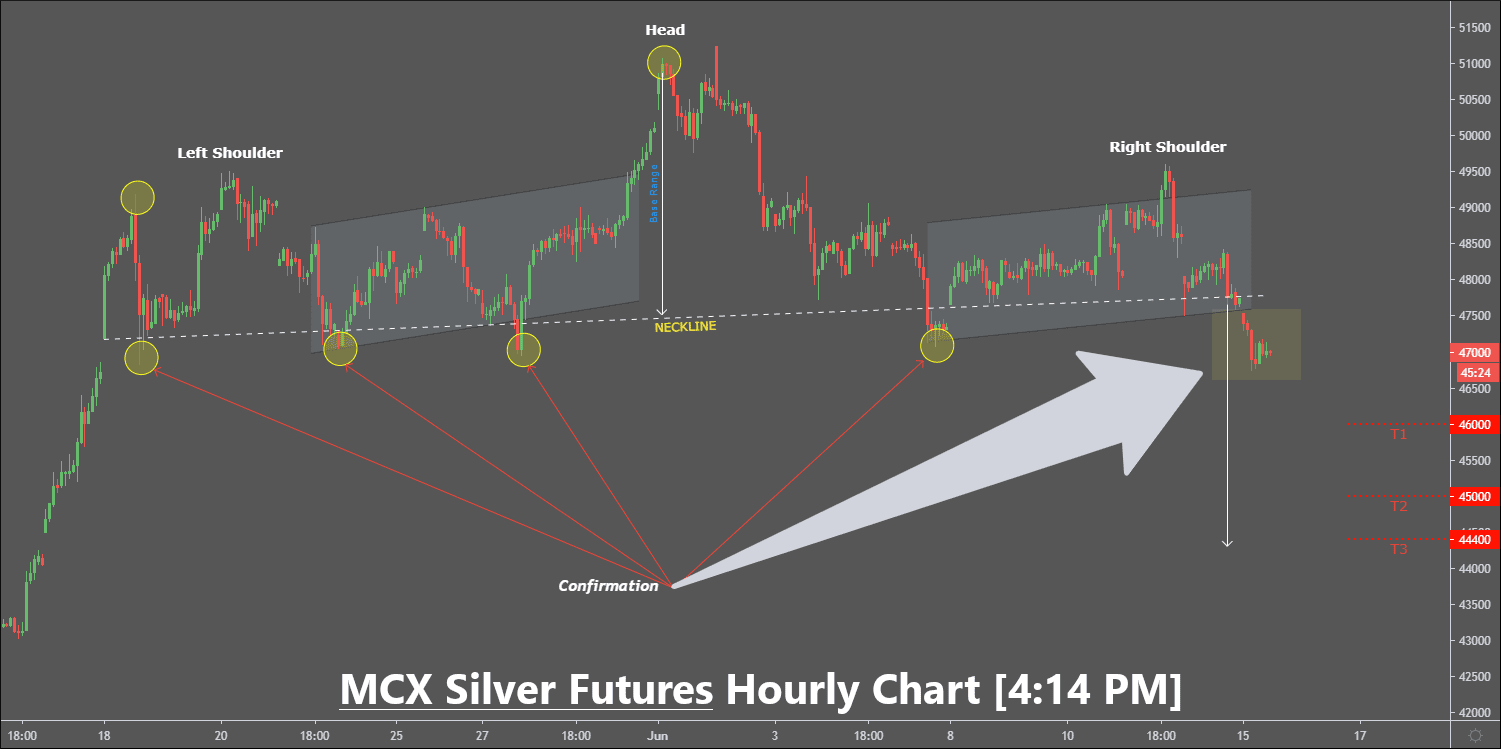
Silver Decisive Breakout!
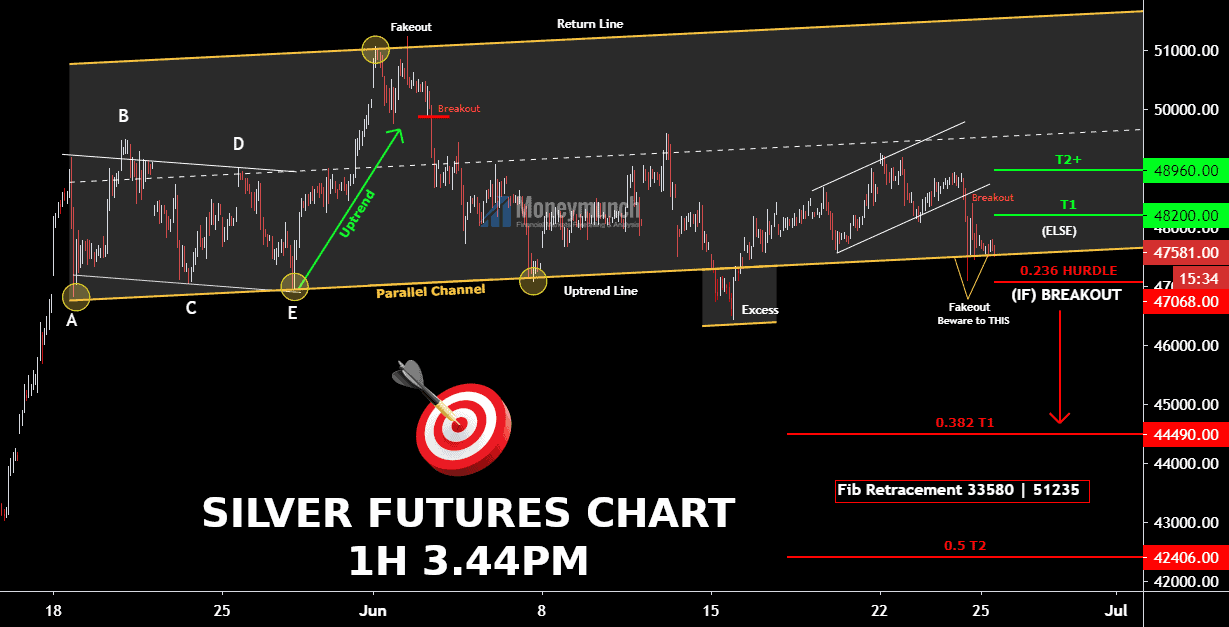
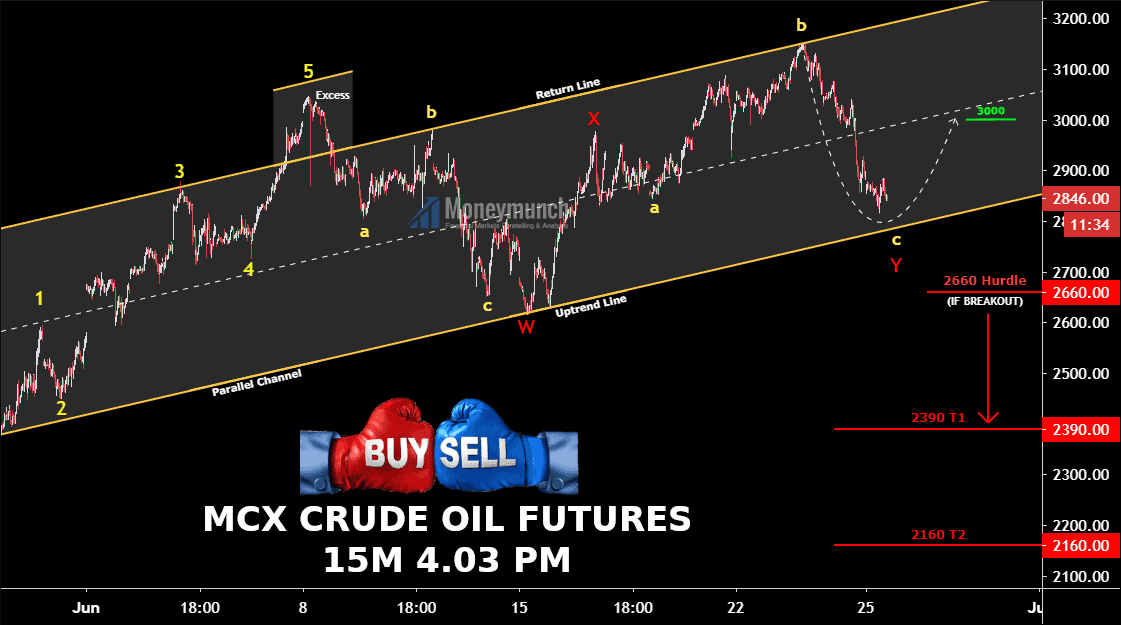
Crude Oil Clearly Reverses at Consolidation’s Upper Line
To become a subscriber, subscribe to our free newsletter services. Our service is free for all.
Continue reading
Get daily MCX trading tips for Indian commodity markets and expert market research reports on bullion, energy, and base metals commodities to enhance your knowledge with our articles and empower your trades.
To become a subscriber, subscribe to our free newsletter services. Our service is free for all.
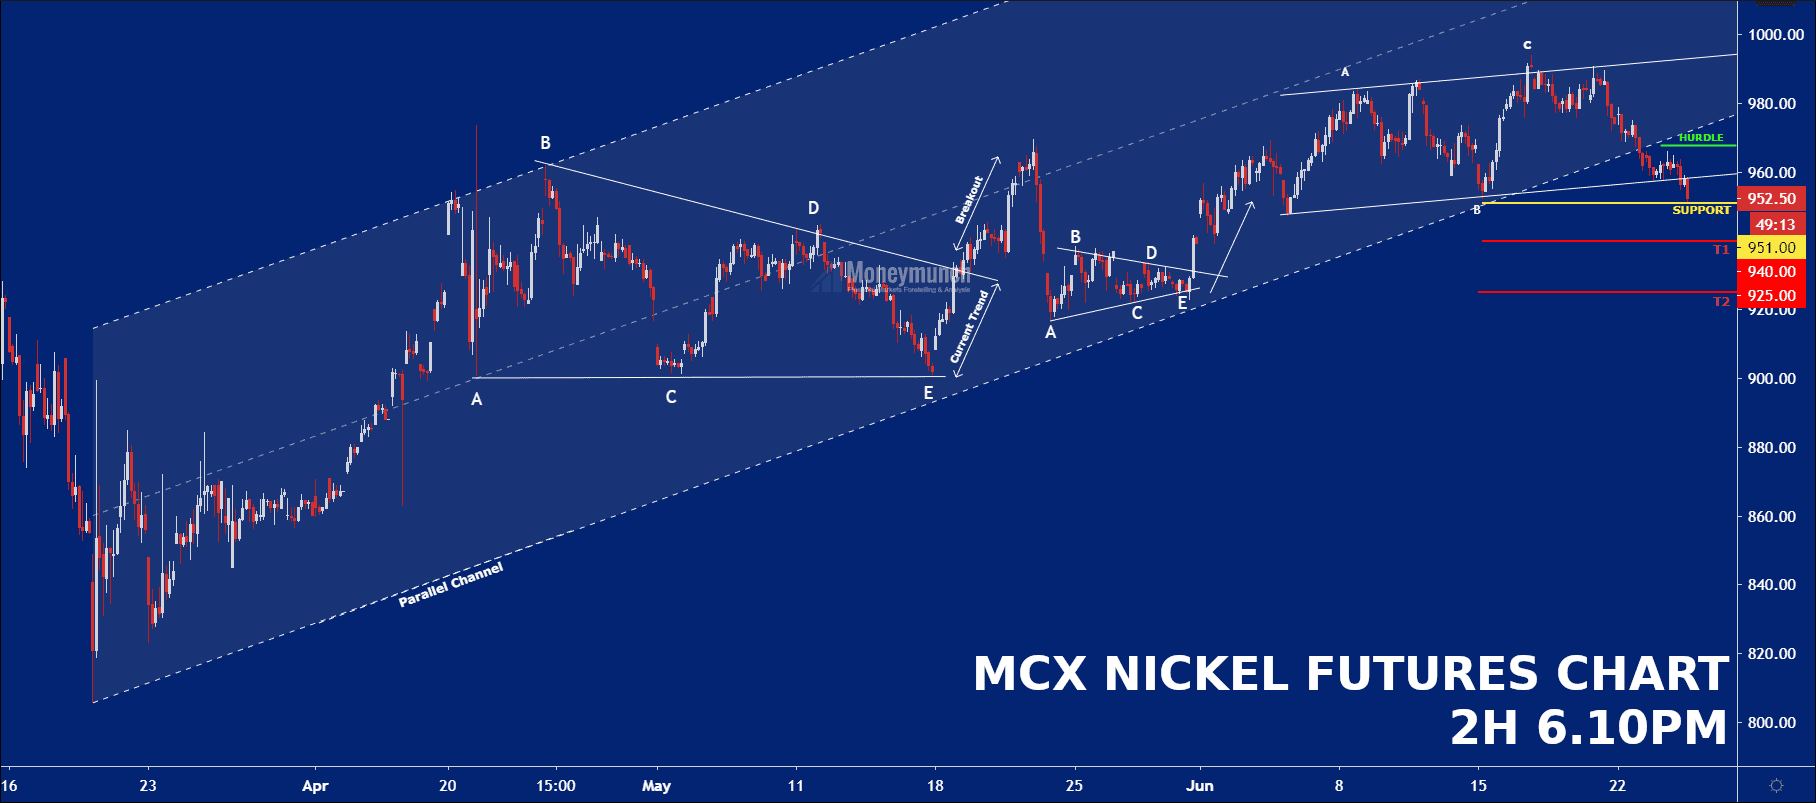
The positive trend will start after a breakout of hurdle.
Targets: 951 – 936 – 925
To become a subscriber, subscribe to our free newsletter services. Our service is free for all.

As per the following chart, MCX natural gas is under downtrend for a short period. Without fake-out, commodity natural gas prices may drop for 118 – 116 levels below.
How about E? If its price remains above the support, we will see 126.6 – 128+ soon.
To become a subscriber, subscribe to our free newsletter services. Our service is free for all.
To become a subscriber, subscribe to our free newsletter services. Our service is free for all.
To become a subscriber, subscribe to our free newsletter services. Our service is free for all.
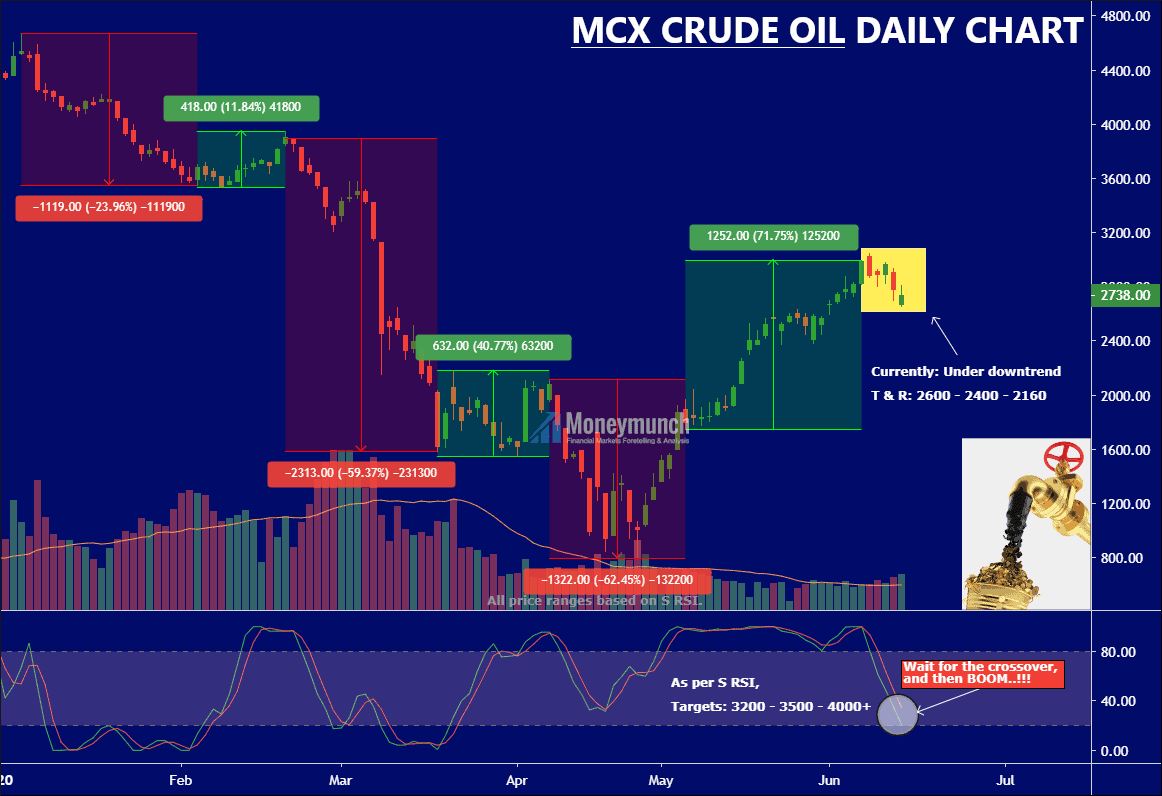
As per the chart, MCX crude oil is under bearish pressure for a short period. It may fall for 2600 – 2400 – 2160 levels.
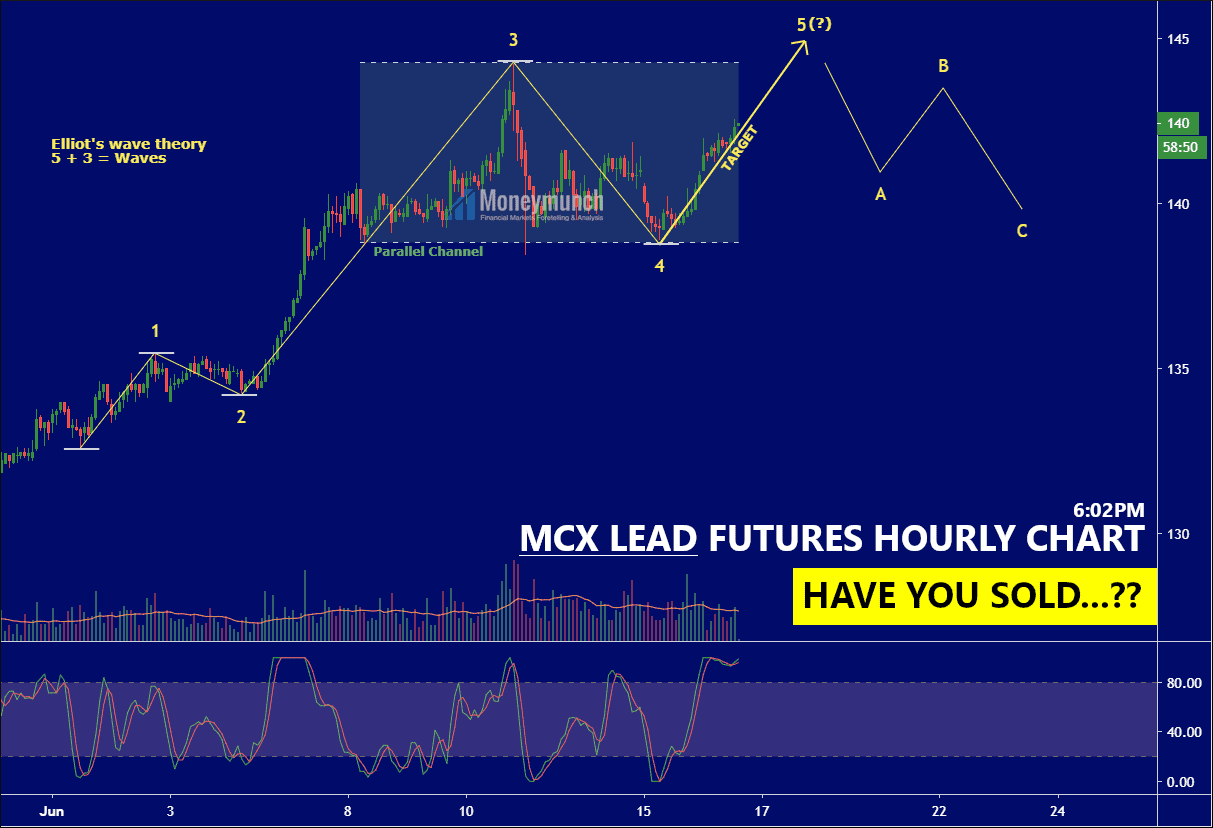
The long-term traders must keep their eyes peeled for a crossover into the S-RSI. The crude oil prices will fly into the sky. Be ready for 3200 – 3500 – 4000 levels.
Do you want to know about Silver?
Read the 3rd June report: MCX Silver Prices Go NEGATIVE! What’s Next?
To become a subscriber, subscribe to our free newsletter services. Our service is free for all.
 Unlock This Article