
Had you traded on our Gold intraday call?
Click here and read that report
We had written to the subscriber to buy at 37630. To become a subscriber, subscribe to our free newsletter services. Our service is free for all. Check this screenshot:
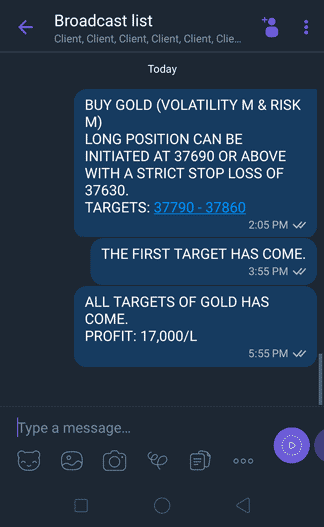
All targets of Gold has come (Rs.17,000 Profit/L).
Continue reading

 Unlock This Article


