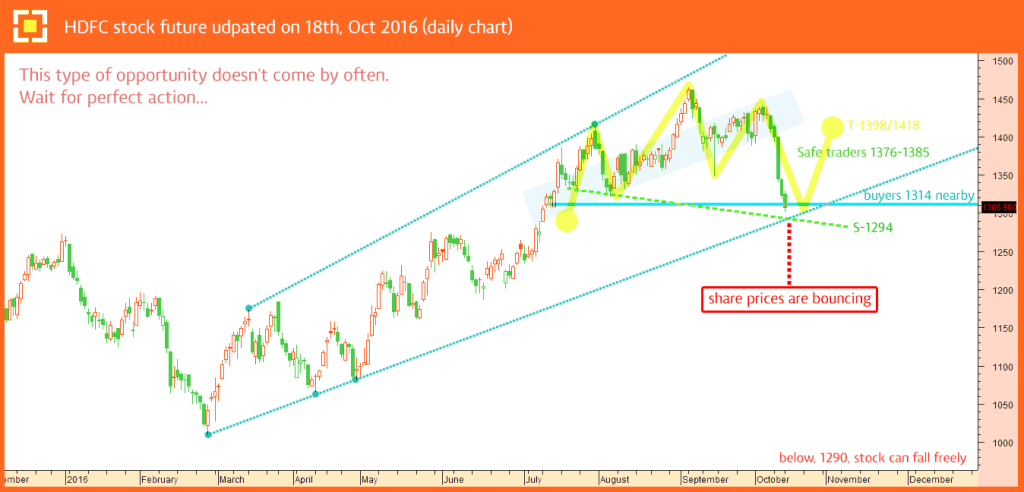
HDFC stock future is good for trading, get ready only. Don’t act if you do not have levels.
To become a subscriber, subscribe to our free newsletter services. Our service is free for all.
Continue reading

HDFC stock future is good for trading, get ready only. Don’t act if you do not have levels.
To become a subscriber, subscribe to our free newsletter services. Our service is free for all.
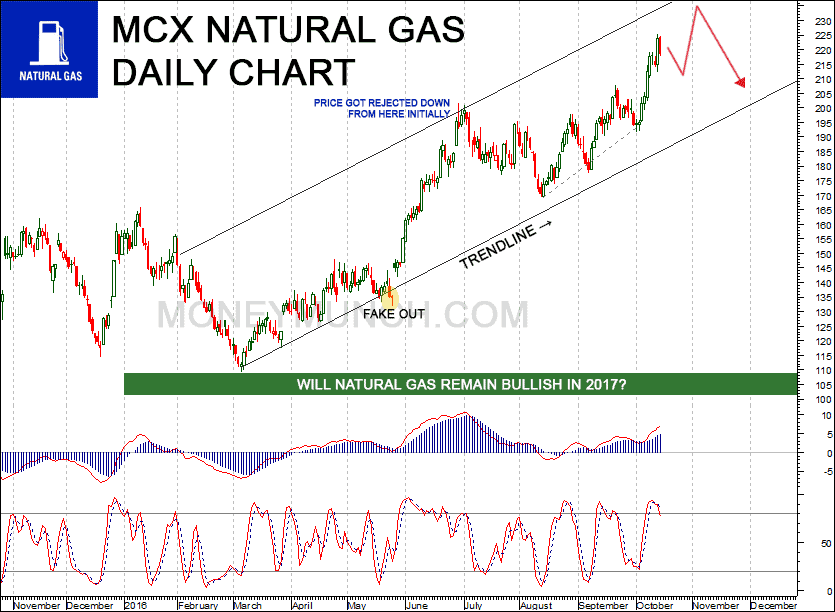
This chart is a daily chart of natural gas. We can see natural gas started moving up after complete the first month (January) of 2016. In May month it made trap for greedy sellers (by fake out) and risen up till June end! But the main point is Natural gas well played in June ending because it had made one more trap for greedy buyers by price got rejected down initially in 29-06-2016 (look at above chart). But this all things are now a history.
Now what will be next move of natural gas?
Will natural gas remain bullish in 2017 too?
Will NG hit 230-246-258-277 this levels before 2016 end?
For read long term view of Natural gas: subscribe to our free newsletter services.
October month is fortunate for natural gas short-term buyers because it gained almost 24.1 rupees! Look at below chart:
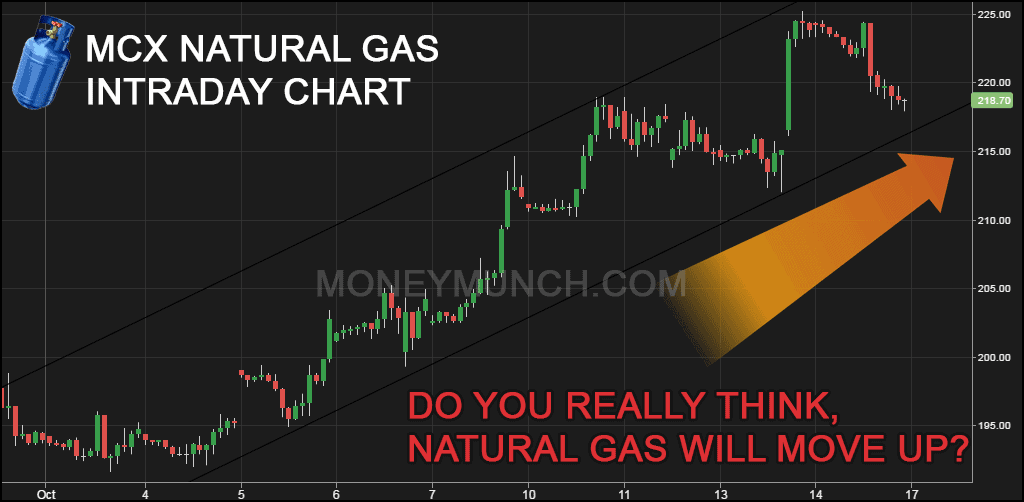
Natural gas may come down up to 216 to make a fake out but if I would recommend to stay with trend and buy natural gas for 225-230 levels.
If MCX NG will try to break 215 levels or close below it then the natural gas could slip up to 210-203 levels. And I think, this information enough for a smart traders and short-terms investors.
But I would like to remind you again this article readers, if you want to BUY / SELL natural gas for long-term and with less risk then I suggest to subscribe our to read full Energy report.
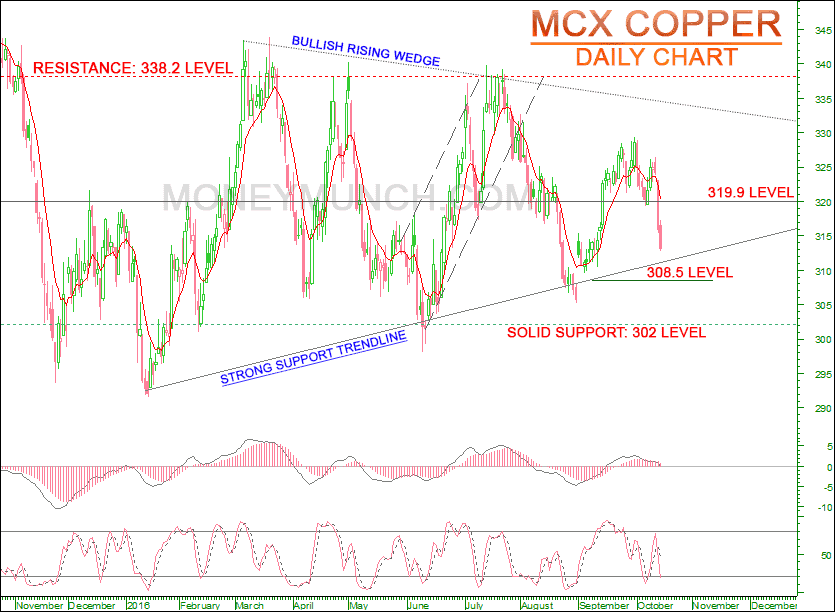
Copper will move continuously upward in 2017 too? Well, I think I should to update that later. At the present time, copper is making bullish rising wedge and strong support trendline is suggesting upcoming days. It can generate fake out up to 308.5 levels before this month end, but you may continue buying the copper for 319.9 levels!
Keep in mind, 308.5 levels below closing can drag the copper down up to solid support level.
If you want to analyze copper and aluminium technically then I must prefer to read my 1st Aug, 2016 newsletter. Click here to read old report of Copper & Aluminium
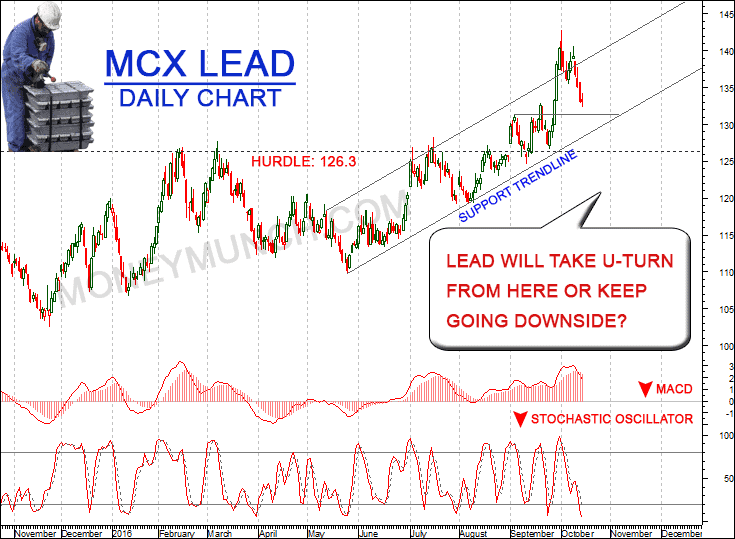
Look at above MCX Lead daily chart. You may see MACD & Stochastic Oscillator indicating the down signals but small support is coming up at 130.7 level so what your strategy for intraday trading? You can share your view on lead in below comment box and I will update full report of MCX Lead for subscribers! To become a subscriber, subscribe to our free newsletter services. Our service is free for all.
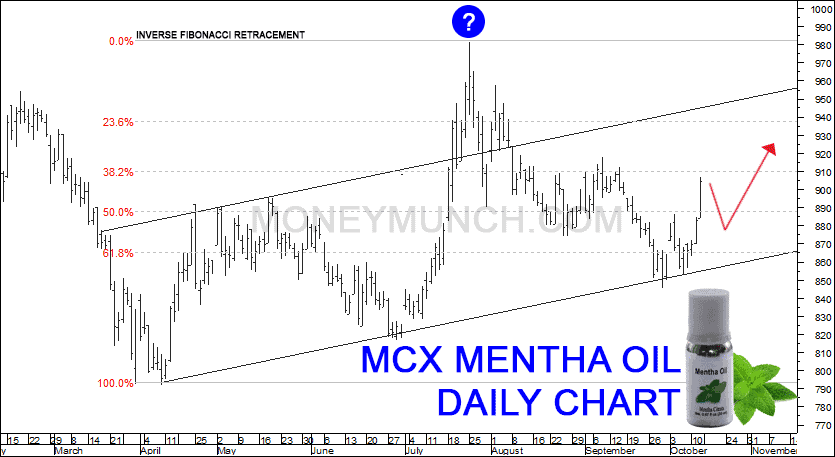
Look at above MCX Mentha oil intraday chart. We will see shortly small selling pressure on mentha oil and it could slip up to 880 below levels.
If Mentha oil will close above the 920 level then then we will see 940-950 levels before 2016 year-end!
I think, gesture is enough for smart traders so I’m not going to explain in details.
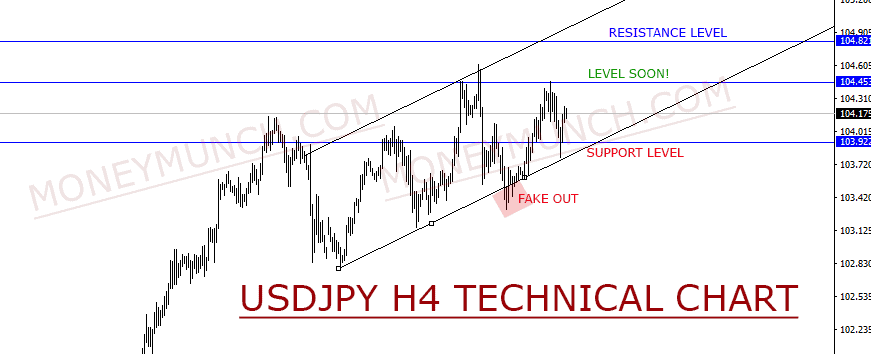
USDJPY Index is going back higher.
USDJPY long-term patterns (121.675 high @ 29/01/2016 and 99.528 low @ 16/08/2016) suggested, USDJPY will reach 104.453-104.821 levels soon.
Keep in mind if USDJPY index cross-over or close below 103.922 level, you can see downtrend and support will be found at 102.81 level.
594 $ Benefit taken our premium subscriber last week in only one trade.

To become a subscriber, subscribe to our free newsletter services. Our service is free for all.
Cotton Down Today and Tomorrow?
I’m saying to sell cotton over 2 weeks and if you don’t believe that then click here to read last cotton report. But the question is, is it still down? I would like to say, yes! Cotton will continue drill downwards.
If the selling pressure will remain on cotton then it could move down up to 19080-18760 levels.
Cotton rising signals will generate in only 1 condition and that condition is ‘cotton need to close or stay above 19830 levels‘.

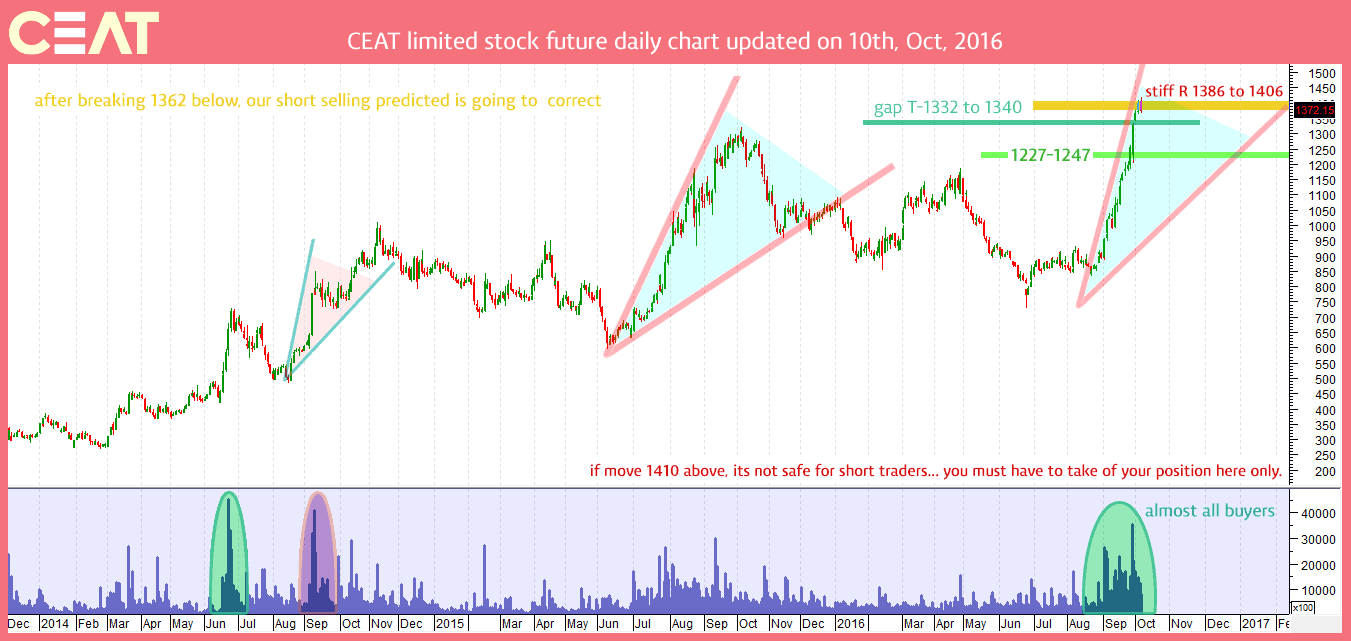
My newest trade idea, CEAT, presents us with an opportunity for significant downside over the short term. The exact amount of downside and amount of profits for grabs totals an amazing 75-123 points—all or most of which you can grab the profit in couple of day. First, look at the chart for the trade level and with risk factor.
As per chart researched, this stock has good opportunity to sell 1400 nearby. There are risks is involved 1410 above closing. Two type of targets are mentioned in chart. If you want to trade, Risk and reward ration is good gap.
To become a subscriber, subscribe to our free newsletter services. Our service is free for all.
I had boldly written, “I would like to say, if gold will breaks and close below last trading session low (31205 level) then it can drop up to 31000-30870-30700 levels.”
The day before yesterday Gold made low 30670 and touched all targets!

I have clearly said, “If silver will crossover / break $19.60 level then traders should be sell it for $19 below levels.“
At the same day (26 Sep) silver made closed below $19.60 levels and look at now Silver is running around 18.8 level.
Even, I had said same things in the password protected zone for MCX Silver to premium subscribers, “MCX Silver will remain down on next week. It may slip up to 46190-45560. More information I will update due to market hours.“
Silver all targets has been achieved!

I had clearly said, “…once it touch that level or move around then you will see 130-132+ levels within 2-3 trading sessions.“
As expected, it touched all targets even yesterday it had made new high 142.7!

I had just written direct targets “856.5-847.5-833.5-820 below!” without more explanation in the newsletter.
It completed the second target 847.5 levels. What are you expecting now?
Will it touch the next targets or turn back from here!? For to know it, subscribe to our free newsletter services. Our service is free for all.

Here’s what I had said about cotton, “Sellers are digging downside cotton price. If it will open negative then traders should sell at opening bell or if cotton open upside then you may sell it on best top as per your knowledge. It will hit 20000-19700 levels before this week ending.”
Did you know that in the next 3 trading session it touched both targets!

What did I said about NCDEX Guarseed? I had said, “NCDEX Guar seed in short-term downtrend. Stop loss for free users, last trading session high!
Targets: 3600-3520“
Guarseed all targets has been achieved successfully!
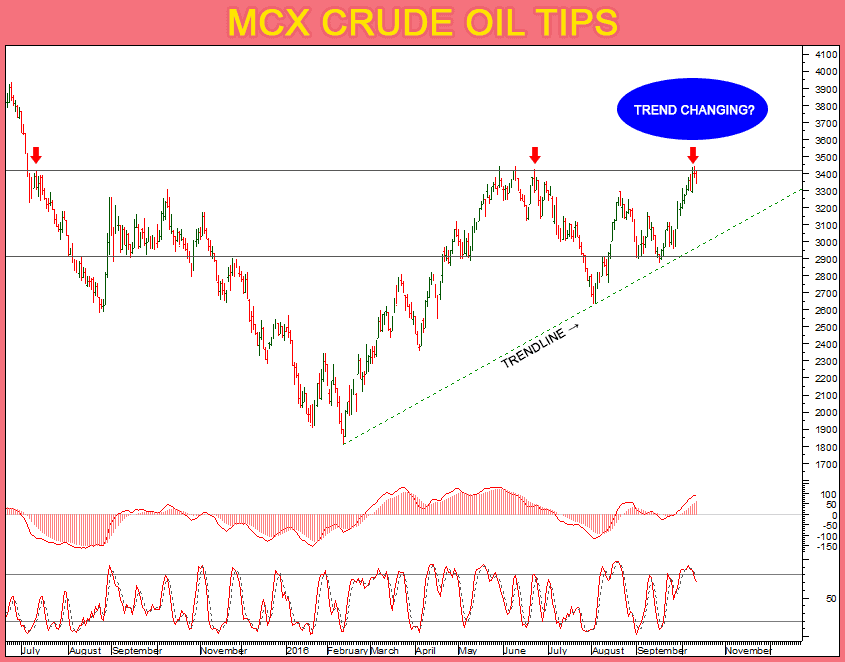
Note: CPO failed to touch the target. Crude oil, Natural gas & Jeera on the way. I will update on next newsletter!

Now let’s calculate approximately profit in 1 lot size.
| Trading Alerts | Booked Profit | Profit |
|---|---|---|
| Sell Gold @ 31200 | Booked profit @ 30700 | Profit: 50,000 |
| Sell Silver @ 46750 | Booked profit @ 45560 | Profit: 37,000 |
| Buy Lead @ 127 | Booked profit @ 132 | Profit: 25,000 |
| Sell Mentha oil @ 876 | Booked profit @ 847.5 | Profit: 10,260 |
| Sell Cotton @ 20300 | Booked profit @ 19700 | Profit: 15,000 |
| Sell GuarSeed @ 3600 | Booked profit @ 3520 | Profit: 8,000 |
| CPO Failed | Approx. booked loss @ 4 points | Loss: -4,000 |
| Total Profit: 1,41,260 |
If you traded with only 1 lot then you are capable to getting profit approximately 1.4lac from our newsletter only.
 Unlock This Article