Part III: Weekly Analysis of Crude oil

crude oil tips sms screenshot

We had written clearly, “As per technical analysis and trend lines basis, crude oil is under uptrend. It prices can hike more if crude oil crossover and close (consecutively) above 4100 levels. It can jump up to 4200 – 4350 – 4500 levels”.

The second target of crude oil has come (Profit Rs.25,000/lot). Even our =subscribers are also in buying since 24 March.
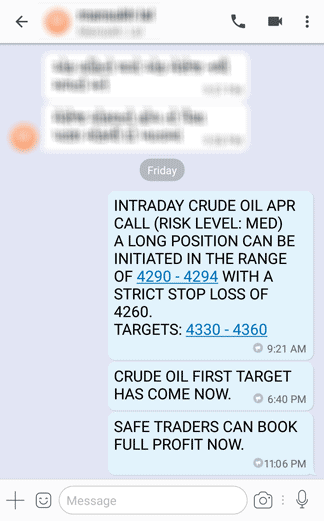
Plus, we’re enjoyin’ in intraday as well. See the screenshot

Do you think it will touch the 4500 levels before this weekend?

To become a subscriber, subscribe to our free newsletter services. Our service is free for all.

Continue reading

MCX Trading Alerts: Silver, Natural gas & Zinc

Is Now The Right Time To Invest In Silver?

silver tipsDid you read our last silver alerts? If not, click here. We had written there, “Keep note silver support level is 37200 price”. After touching our support level, It took the U-turn.

But this is not an assured confirmation for the uptrend. Yes! A downtrend can be confirmed if silver breakout the support level and close below it consecutively.

And this downfall can drag down the silver’s price up to 36600 – 36200 – 36000 – 35800 levels.

Note: a sideways trend will continue between 38000 and 37200 range. An Uptrend will confirm after breakout, 38000 level. Don’t think much about downtrend. It’s time to focus on Intraday trading.

natural gas tips

Should we keep selling Natural gas?

Yes! But after 182.6 level. Complete breakout will require.
Targets: 178 – 172 – 166

free commodity mcx zinc intraday tips

Important note for Zinc traders

As per the last Zinc forecasts, it has touched all levels. It’s very close to the all-time high (232.7 level). Short-term/long-term investors must wait now. This week, we might see above the 230 level with sideways movements.

To become a subscriber, subscribe to our free newsletter services. Our service is free for all.

Continue reading

Its Time To take Advantage Of Knowledge Over The NIFTY, Studied

Last friday, NIFTY future was followed accurately our intraday trading level.

price-action-anlaysis

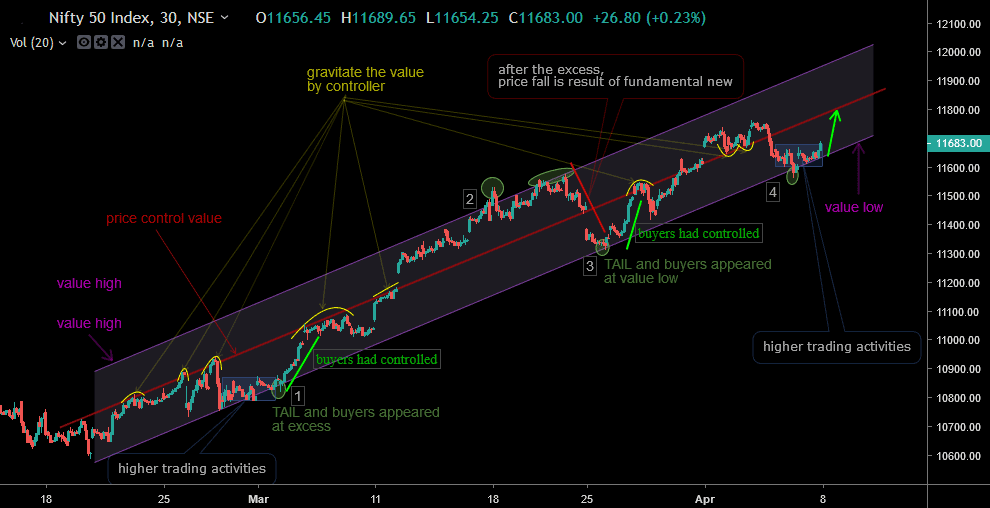
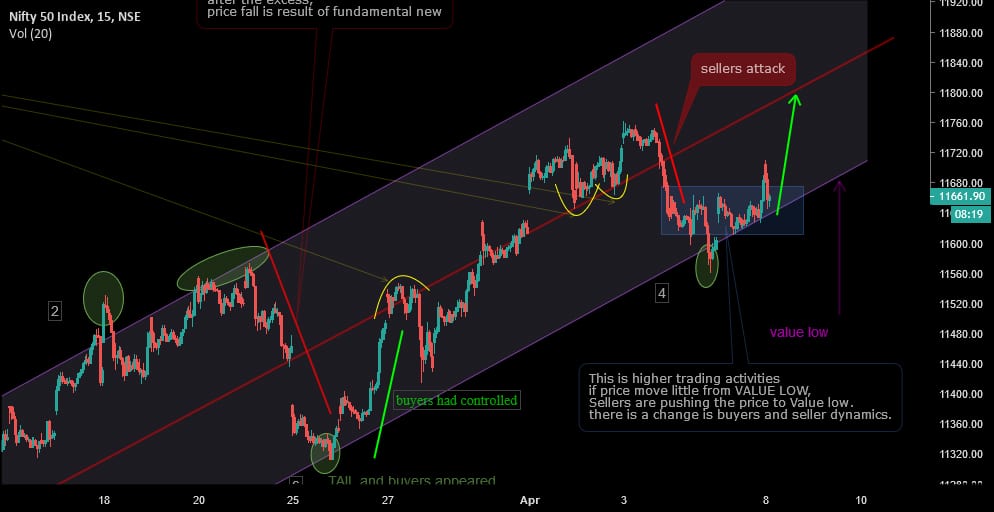
The right side of NIFTY chart, we have found that price rotation and higher trading activities plotted it by using a rectangle. Price value gravitating by control value. Suppose, it’s true then, nice can move upto 11780 again. Above 11626 we can think the bullish for the short term.

Price ration between buyers and seller are in the range of 11598-11678 appeared. (avoid the 3% penetration, any side price can see fire move)

In fact, there are the number of 5 excess, but I have shown 4 five excesses. Each excess has given single direction move, and we are at 4th excess.

nifty-spot-war

We have seen very high trading activities when price moves away from VALUE LOW. It means, a war begins between buyers and seller at VALUE LOW. Sellers are ready to sell NIFTY if the price moves up, in another way buyers defeating with sellers.

just keep patience, wait to break the price… This is a critical situation. Just try to know which side seeing smart money, pension fund, hedge, insurance company, bank, broker, large individual traders or what every you called…

To become a subscriber, subscribe to our free newsletter services. Our service is free for all.

Continue reading

Clear projection for NIFTY and Nifty future, will not fall…!

Yesterday, Exactly Nifty future followed my level. I had written that selling will come to 11758 and NF made high of 11754. The target was achieved by NIFTY as 11667.

11700 PUT of NIFTY was achieved target 128 and made high (138) from Rs. 22.

nifty-future-intraday-15min

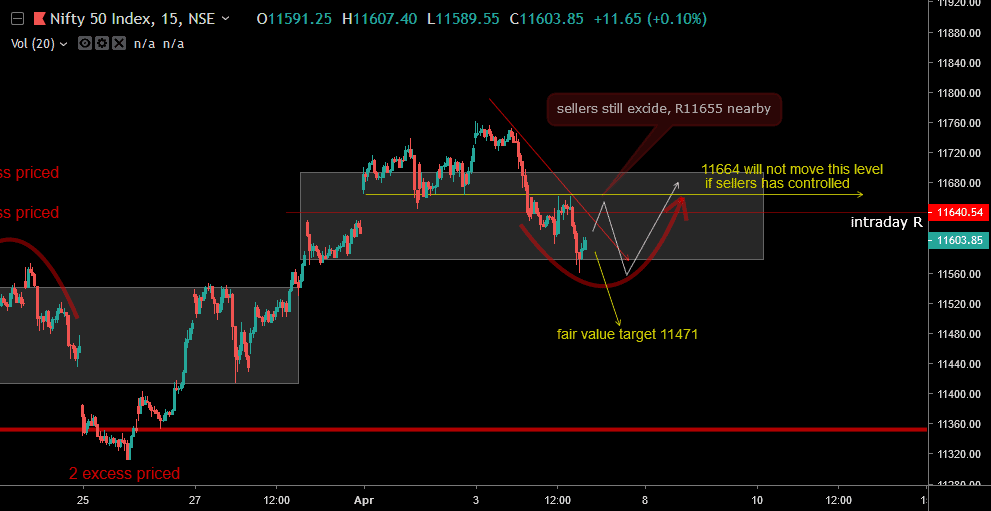
This is spot Nifty chart.

Resistance is for spot nifty at 11674 nearby (suppose to not cross it and stay above it): If cross it then, we can face this level as fair value.

Targets for Spot nifty 11529-11518

Nifty future

Resistance 11738 and 11756 (selling expected),
if cross the price 11750 and stay for 15 min above it. Then NF can move up.
Support and targets 11654-11664 intraday.

To become a subscriber, subscribe to our free newsletter services. Our service is free for all.
Continue reading

Trade Setup On HDFC In Advance For Safe Traders

After the long time, I have came back stock future scripts. 

HDFC-stock

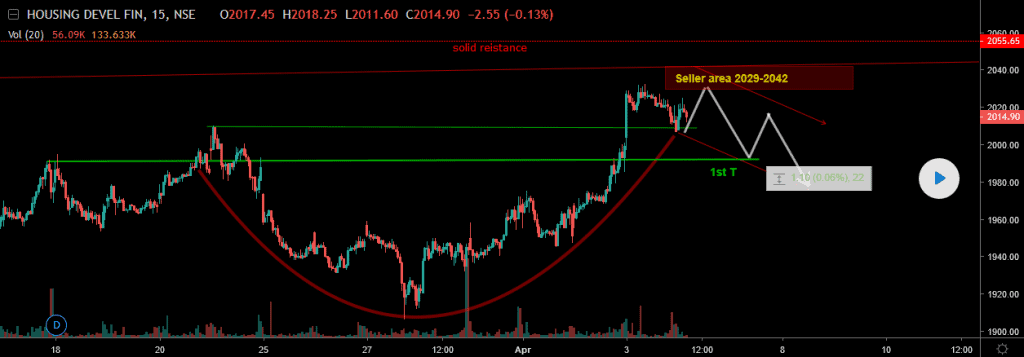
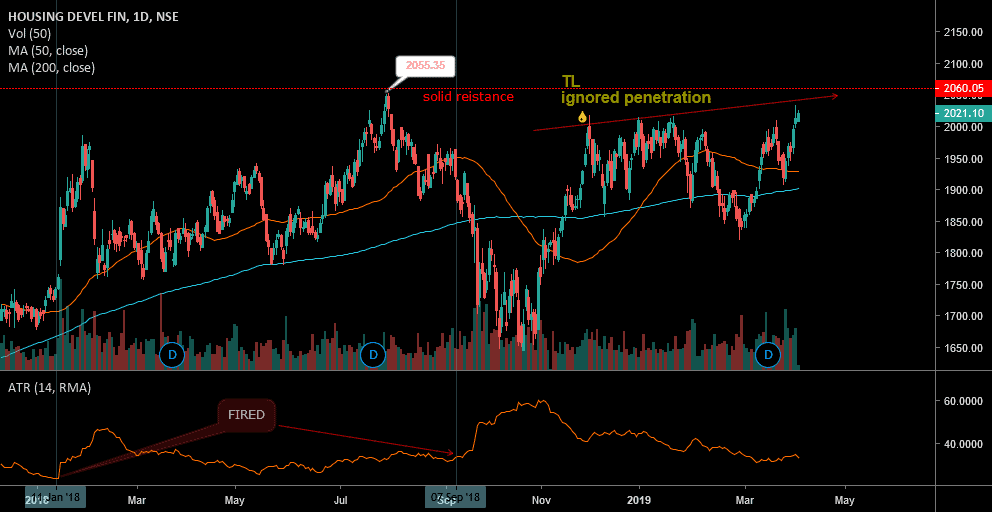
Seller area 2029-2042 for targets 1992-5.
How will you decide to short it this range or wait?
Hits: 2X/3x volume while the range, then short sell it.

Future Level for HDFC:

R 2055-68 nearby for targets 2008-12

Daily Chart Time frame with ATR and, neutral supply and demand zone.

hdfc-daily-chart

To become a subscriber, subscribe to our free newsletter services. Our service is free for all.

Continue reading

Trade Picture For Tomorrow NIFTY, Sold@11797

Yesterday we sent to subscribers: Sell NF 11789-11798 with stop loss of 11824 targets 11724 and 11611-11578

First target has been achieved.

nifty-spot-intraday-chart

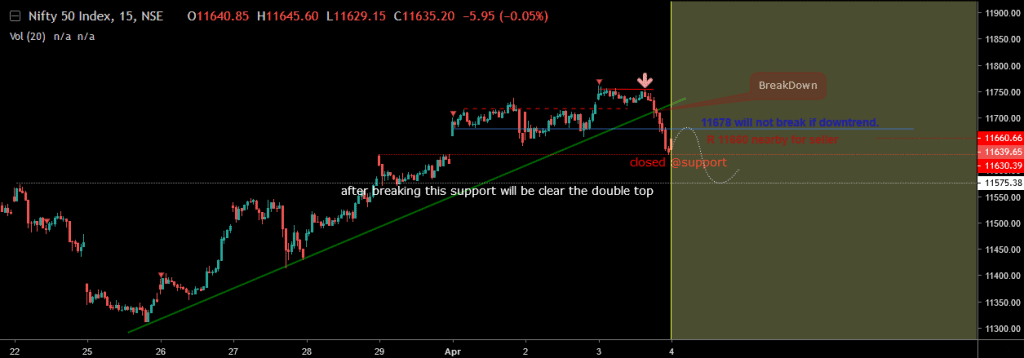
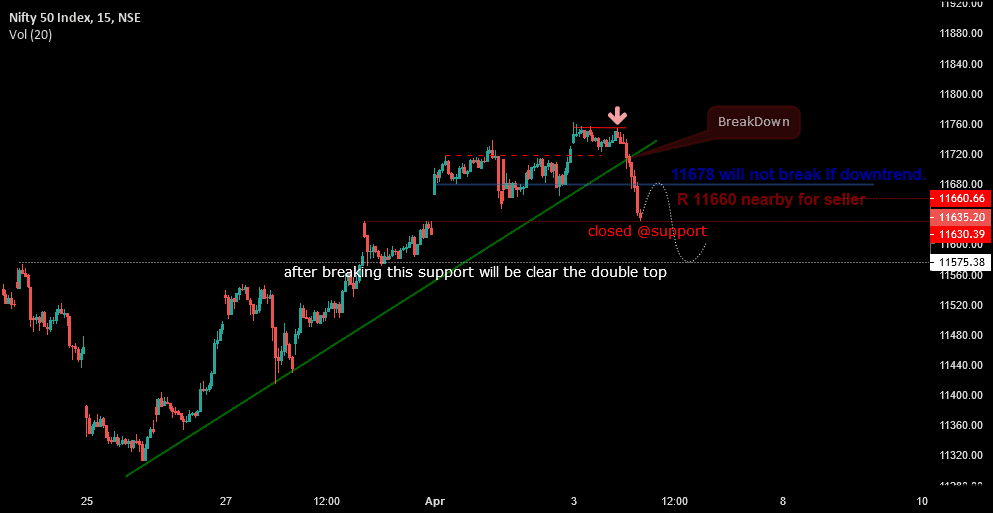
Nifty closed at S. 11624 which give it move.
Short trader should keep stop-loss 11679 above as trial.

Intraday R. 11659 nearby (seller can come to this point intraday) with intraday support @ 11575 nearby.

NIFTY FUTURE:

Pivot S 11702,
Intraday targets 11668-11676 and this is support also.
Suppose to not break 11670 below, then it can bounce upto 11724-11748 and upto resistance 11770.
Below to 11670, NF is not can fall 100-130 points.
Resistance is too far at 11776.

daily-chart-nifty-future

Nifty ATR is at 111 which means if short term downtrend started, then 11635 -111 = 11524 below.
Double Top is not clear still.

  • RBI monetary policy on April 4.
  • The selling in the last hour.
  • Forming ‘Bearish Engulfing’ pattern on daily chart.
  • The short term trend of Nifty is weak.

NOTE: Both charts are for SPOT NIFTY.

To become a subscriber, subscribe to our free newsletter services. Our service is free for all.

Continue reading