Will Gold & Crude oil Breakout Or Breakdown Next?

gold tips

Technical Perspective of Gold

Reversal range: 31760 – 31700
A complete breakout of reversal range indicates a downtrend trend. It could be up to 31500 – 31400 levels.
After touching the reversal range, gold prices can hike up to 32000 – 32200.

Q. Which level will give 100% confirmation for the uptrend?
A. Consecutively two days closing price above 32300 levels.

To become a subscriber, subscribe to our free newsletter services. Our service is free for all.
crude oil tips charts

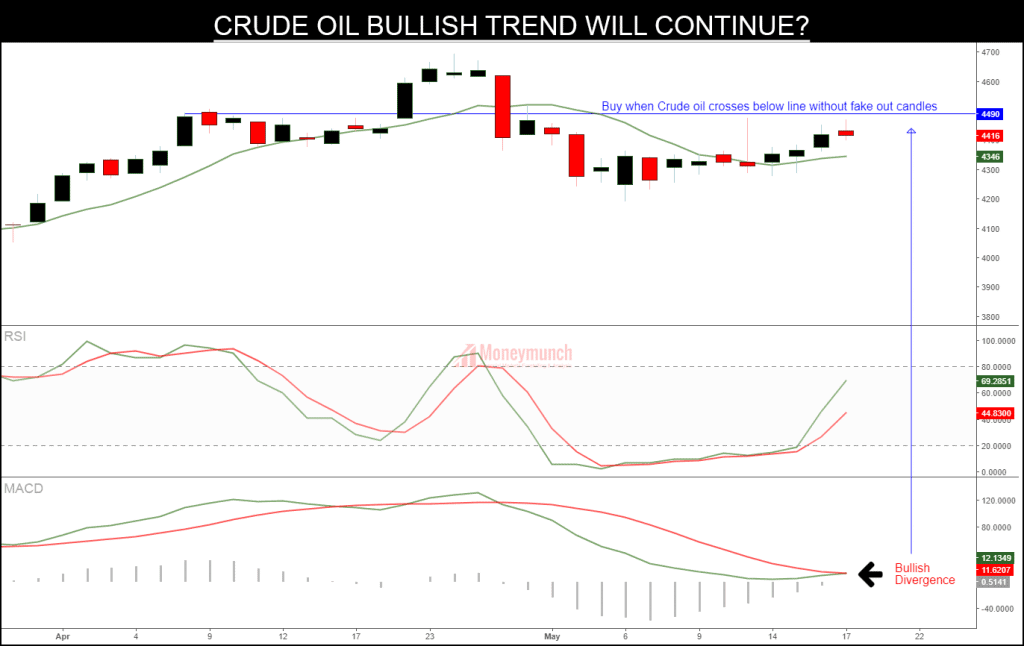
As per the above chart, Crude oil bullish trend will confirm after 4490 levels. This level can hike the crude oil prices up to 4600 to 4700 levels.
If it prices will remain under the blue line, a downtrend will initiate. And crude oil prices will crash up to 4300 – 4260 – 4200 levels.

Continue reading
Banknifty Footprint will guide exact trade entry

These call were given to our paid subscriber  the target was achieved:

SHORT INDIGO fut 1514-1522 and stop-loss 1530 and targets 1464-1414

Yesterday target achieved…
BUY CADILAHC intraday cash 273.5-271 and stop-loss will be 270 below and 286-294 intraday if close above 285.. then hold it 301-314.

To become a subscriber, subscribe to our free newsletter services. Our service is free for all.

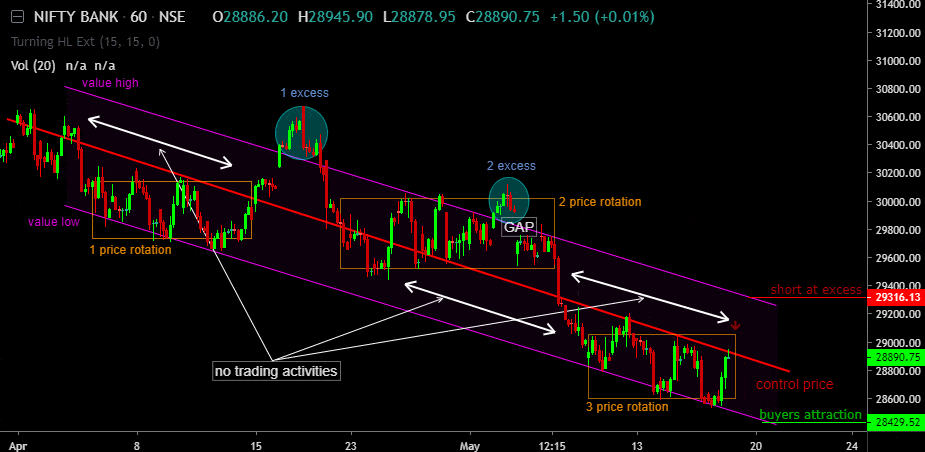
  • There are two excess found above the Value High. 
  • 3-price rotation, on the value area. 
  • Above the control price, there are not trading activities detected. 
  • Last closed price is at control price. 

Conclusion, Buyers always look at excess 28429 of value low and sellers attraction should be at excess 29316 of value high.

Continue reading

Announcing a New App for Commodity and Forex Subscribers

Important Note: We are going to discontinue support on the old app. This new app is available for compatible Android smartphones and BlackBerry as well as Windows Phone, iPhone, iPad, iPod touch, and Desktop.

Please log in and read this article to get a download link and features introduction.

A Good point for long traders on NIFTY

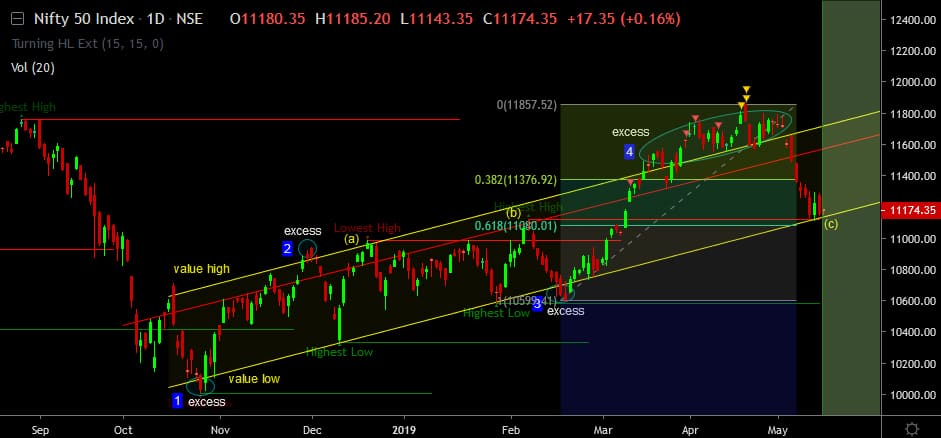
  • Fin. Retracement 61.8% at 11080.
  • Previous Highest High(b) at 11100.
  • Important level 10985, is at Lowest High(a).

At the expected excess-4, where trader’s attraction will create for long.

To become a subscriber, subscribe to our free newsletter services. Our service is free for all.

Nifty spot updated on (20th, may 2019)

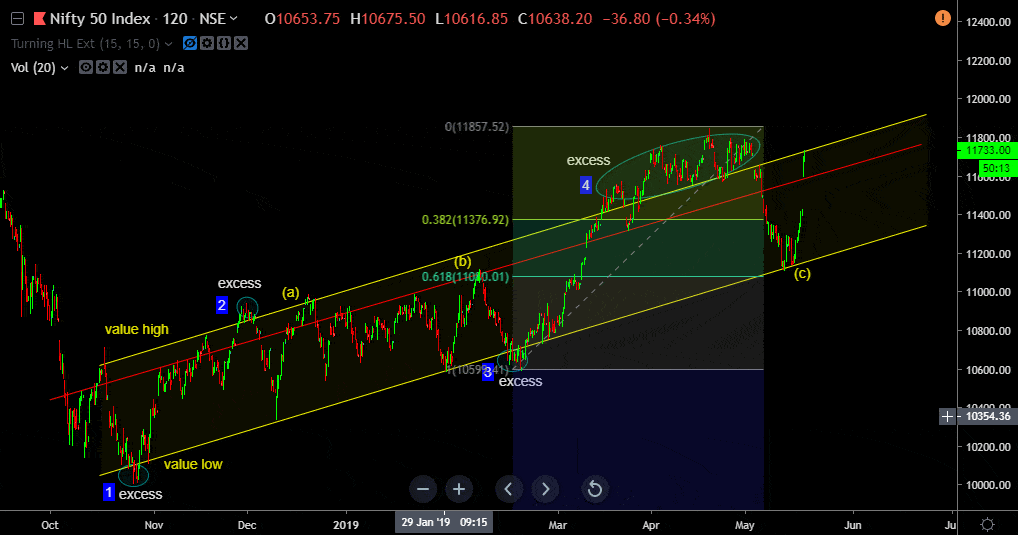
Look at the chart, spot nifty moved from 11174 to 11733 in 3 trading days. There was 550 points different.

Exactly, I told you to BUY 11174 nearby in the chart with (c). And you know what happened.

I hope you also enjoyed our research, if not then still we are with you.

Continue reading

Crude Oil Price As Bearish as it Seems?

free crude oil tips

Crude oil Next Move

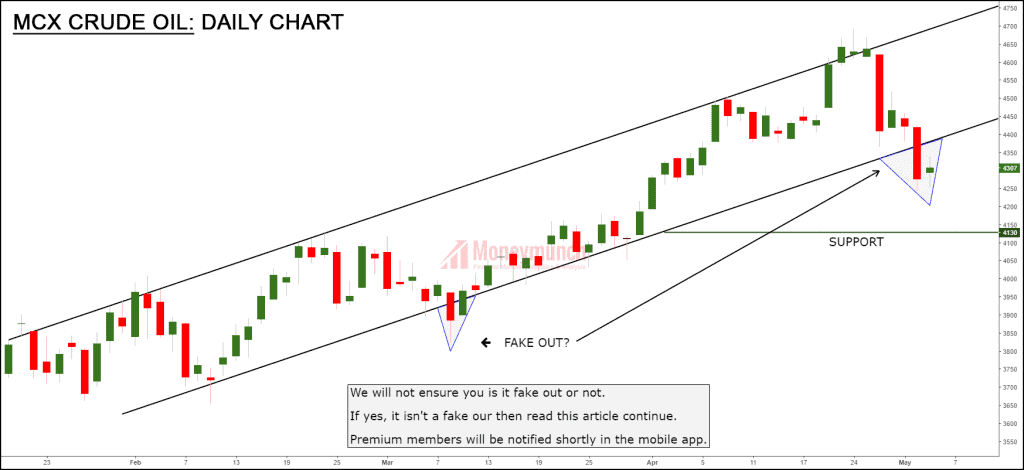
Crude oil may fall up to 4200 – 4130 but don’t initiate sell position above 4400 levels.

To become a subscriber, subscribe to our free newsletter services. Our service is free for all.

Continue reading

Technical Perspective of Silver – Recommended for Intraday & Positional Traders

free silver tips chart

Look at the chart and see silver is running between the trend line from one year. Is it possible, it will start moving in an uptrend before this month end? Or downtrend will start?

We have already said to sell silver on 8th April. Don’t forget to refer the previous report of silver: click here

So, what will happen next?
To become a subscriber, subscribe to our free newsletter services. Our service is free for all.

Continue reading